

▼ Most saved
Data visualization
Free mode
100% free
Freemium
Free Trial
Featured matches
-
 Poojitha Bandaru🙏 8 karmaDec 26, 2025@ColumnsUI Experience is fast & good with free account limited data (100 csv records) but no 3rd party integrations and limited data connection and no 3D /funnel many more chart visualizations are missing.
 -
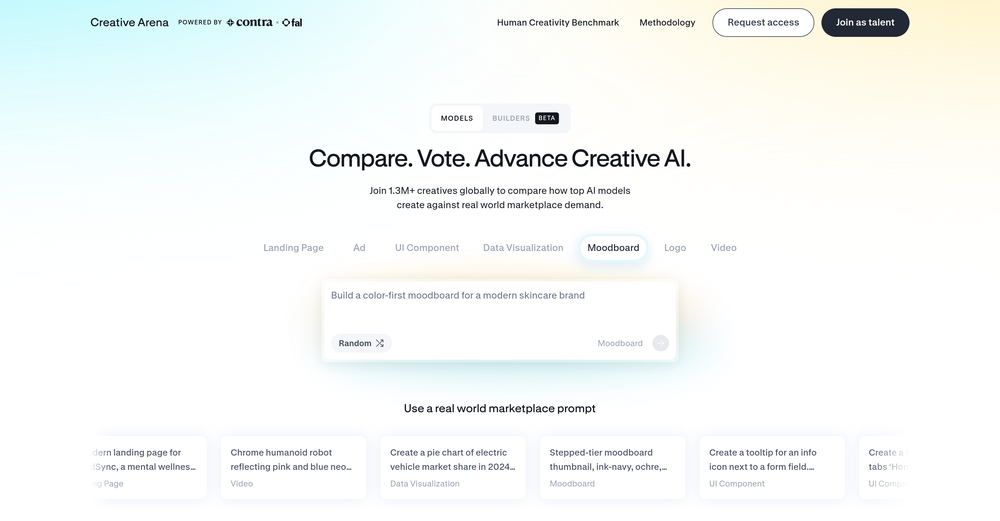 The leading generative media models on fal combined with top-earning real-world creative talent on Contra is a powerful combination. Feedback to fuel the future of creative ai.
 -
 This is truly a wonderful experience that brings joy and delight.
 -
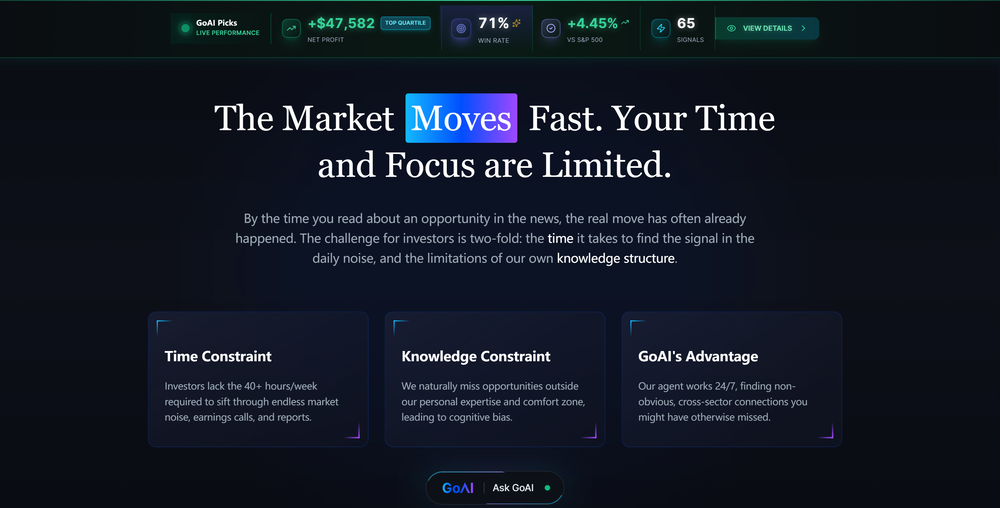 GoAI turns market noise into transparent, actionable investment logic. Go check your favorite stock for an instant deep-dive and see what the AI reveals. Feedback welcome!
 -
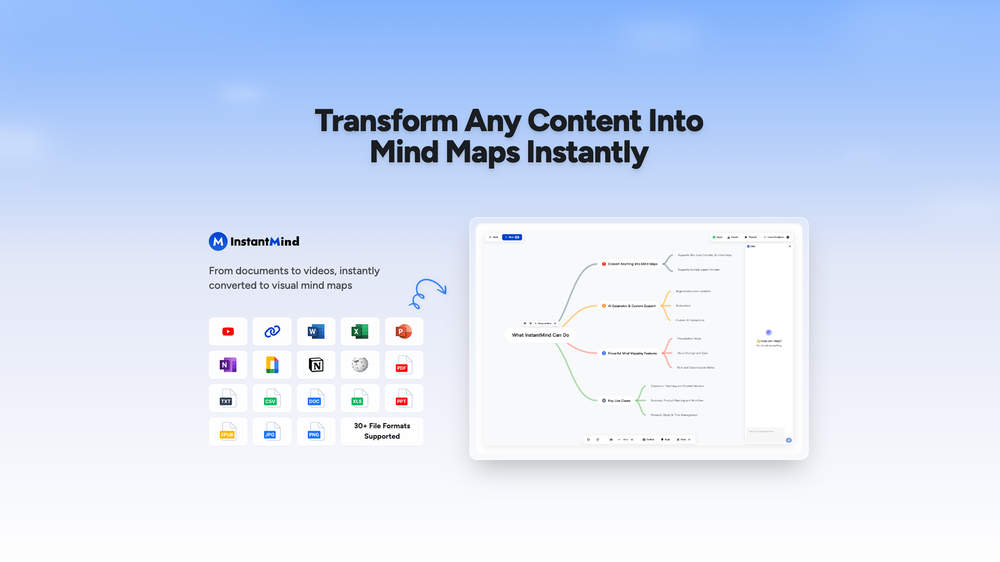
 👋 Hey, I'm the founder of Flowova! We built this because we were tired of spending hours dragging boxes in traditional flowchart tools. A few things you might not know: - Works with anything — text, images, PDFs, Word, PPT, Excel, even photos of whiteboard sketches - 40+ themes designed for presentations - Full Mermaid code support for developers Happy to answer any questions! 🚀
 -
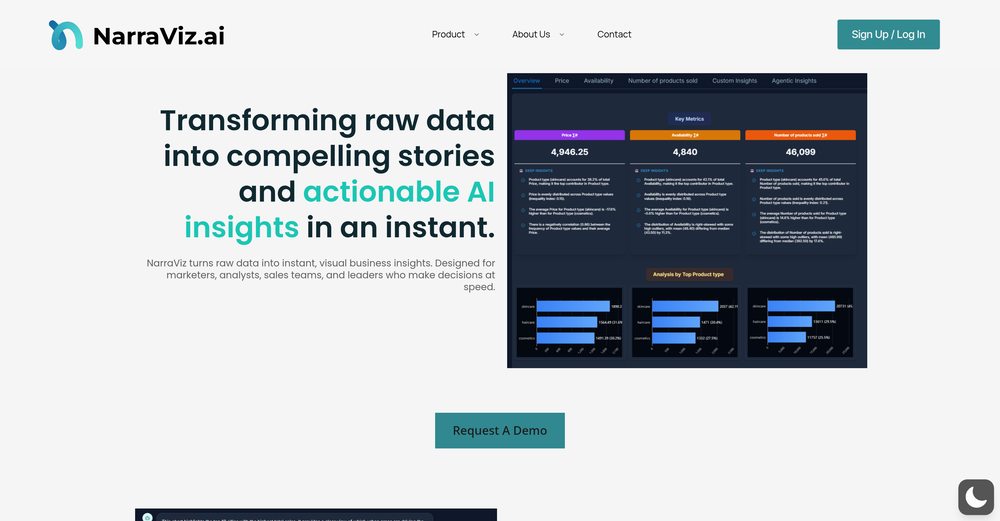
 AI-powered analytics that unlock smarter business insights.Open
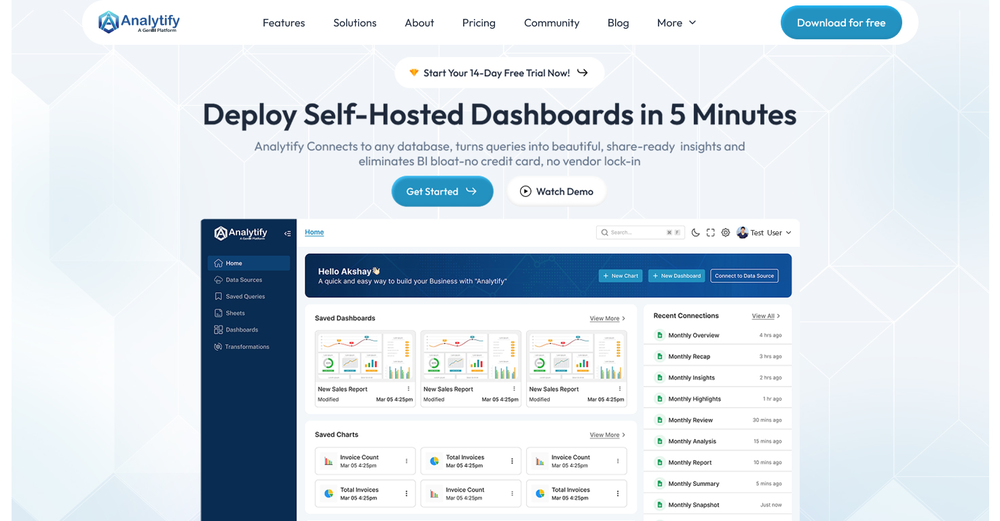 I used Analytify and found it incredibly easy to set up and integrate with Google Analytics, giving me real-time stats and page-level insights without needing any coding knowledge.
 -
-
-
-


Other tools
-
As a UX Researcher - this is an amazing tool to rank and classify various user comments and feedback.
- Sponsor:
 Nebius Token Factory🧠 AI inference
 -
 Automate data work and reporting with AI Agents. No data|coding skills required.OpenSigned up for a pro account for Google Drive integration. Works great! Saves me a lot of manual excel work.
 -
This one was really nice. In that it could also generate a white paper to go with the diagram
-
I really like DataLine, but I'm kinda biased cause I built it.
-
-
 OpenReally great number pattern generator. We have taken your tool and made some advanced changes here - https://texttoolz.com/tools/number-pattern-generator
 -
-
I had to tweak a few things to match my brand style, but overall it saved me a ton of time. Definitely handy if you need something fast and professional-looking.
- Didn't find the AI you were looking for?
-
I felt there is need of more ready made templates. But, it does what it claims. I chose one question suggested by the AI agent, and it created the infographics in few seconds. It's cool. Saving it for future reference.
-
Great tool, offers a lot of data story suggestion and detailed charts.
-
 AI-powered paper writing in 2 minutes: bypass-AI, plagiarism-free, well-researched.OpenThe site is easy to use and has nice features (it suggests titles - it divides the search in a good way, making you choose the number of words you want to write in the search), but the problem is that it writes paragraphs without footnotes and without a list of references.
 -
-
At the moment it works for me, perhaps try again?
-
 Ask data questions, get instant insights, SQL, and charts — all poweredOpen
 -
This has got a super-positive future. After creating just one video, I could see that there would be a large use-case for most industries, including mine with Online Marketing. One thing I did notice was that assets that appear on screen often overlap each other. The same was apparent on most of the other videos in their showcase. Once they get over this hurdle, it'll be worth paying for, for sure.
-
-
Thank you for your feedback! Super excited to see how you get on with Bizzy!
-
"Key Milestones in the Y2K Phenomenon and the Rise of OpenAI": This was result of simply prompting it "Y2K, OpenAI". The results were excellent. I imagine this would be an amazing tool for a large basket of professionals, as well as scholars and more.
-
It’s a powerful and intuitive tool that simplifies complex tasks, boosts productivity, and makes managing work smoother than ever. Highly recommended!
-
Displayr has become an essential tool for survey data analysis. By leveraging advanced AI integration, the platform offers a user-friendly, low-code solution for analyzing survey data. Users can efficiently create presentations while working on data analysis within the same interface, eliminating the hassle of transferring numbers from Excel to PowerPoint.
-
Using it on day-to-day basis to create presentations for my real estate clients. It's good.
-
 AI-powered Excel analysis and visualization in natural languageOpenTired of wrestling with complex formulas, spending hours cleaning data, and struggling to create the right charts? Excelmatic is a powerful web-based AI agent designed to revolutionize your relationship with spreadsheets.
 -
-
Looks promising but found it very slow to load and create templates and previews
-
-
-
Created a dashboard using my Excel file and it gave insights I didn’t even expect. It can read any kind of Excel file no matter the template. I can even check the accuracy by tracing back which column the data came from Great tool. highly recommended!!
-
-
 AI infographic generator that turns blog posts into link magnetsOpen
 -
I was just trying to get a quick graph showing population evolution over the last 30 years, didn’t have the dataset ready, so I was hoping the tool could auto-fill something reasonable. But it literally gave me three values. Three?? For 30 years?? What kind of trend can I possibly see with that? If the tool offers to research the data, it should at least offer a full timeline. And when I pasted the data I found, it created a literally bar chart???
-
 Generate stunning AI images of futuristic musical idols.Open
 -
It greatly supported my R&D work by helping me tackle technical challenges and prepare reports.
-
Says "free during testing," but keeps telling me I have insufficient credits. I also can't seem to find a way to delete my account.
-
Really loved the concept to try out different databases with the Agent
-
-
-
First AI data app I see that can connect databases and my GA4/Shopify APIs at the same time. Highly recommend if you have an ecommerce store!
-
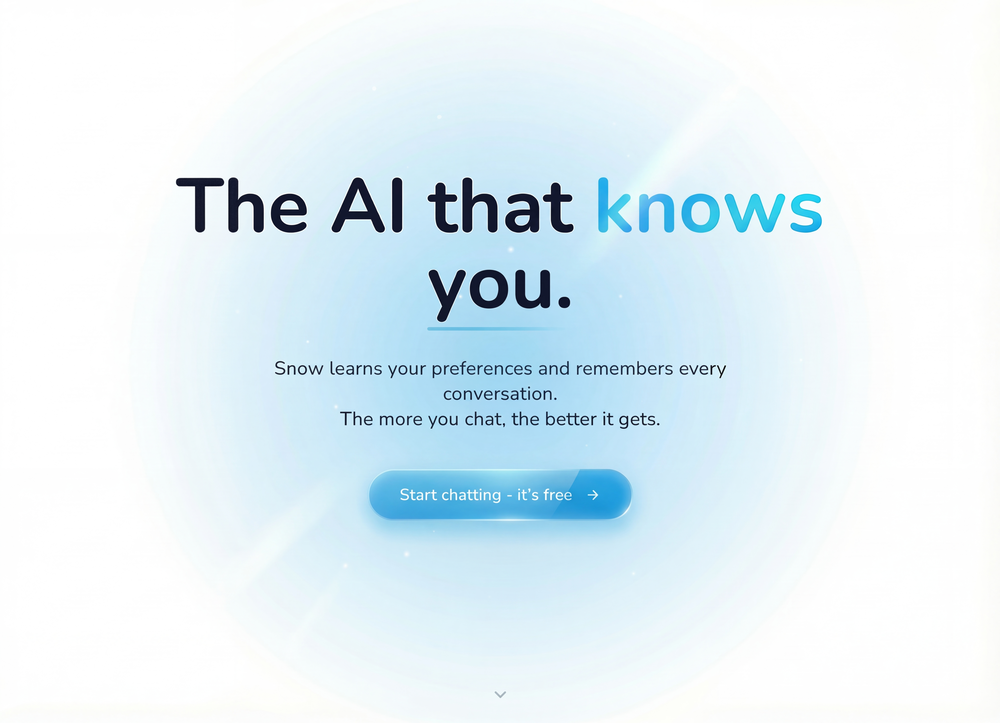
I’d say this is one of the best chatbots I’ve used so far. The side-by-side comparison view is super handy for spotting bias and made-up, and the custom bots actually have decent memory, which is rare. Just a heads up: no image generation or voice mode. Other than that, it’s pretty solid.
-
-
Such a powerful tool with free account, all your data analysis needs with an easy intuitive itnerface
-
it's wild how MLflow takes chaotic experiments and turns them into neat, tweakable apps.it's open source, dead-simple to install and crazy fast at loggin metrics. kudos to the dev :D
-
I should note that I contacted them at the time and they didn't do anything to resolve the issue in their response.
-
 Generate ultra-realistic satellite images with professional detail.Open
 -
Hi Taaft community! I’m the creator of ConceptViz. We built this tool specifically for educators and researchers who deal with complex information daily. ConceptViz uses AI to instantly transform dense lesson plans, curriculum notes, or research frameworks into clear, structured diagrams. Our goal is to help K12 teachers make abstract concepts tangible for students and to help researchers map out logical workflows without the manual drudgery of drawing. I’d love to hear how this fits into your academic or classroom workflow—your feedback will help us build a better tool for the education community! 🚀
-
Create and share Mermaid diagrams instantly in your browser
-
 Turn client workshops into professional deliverables in 30 minutes.OpenVery good. I like it
 -
I got some free credits to try the app when I signed up, I could create a few great infographics
-
I run an early-stage startup. Arka has been pretty amazing for understanding our user adoption data (and then be able to ask follow up questions) in just a few clicks!
-
Dumber than a box of hair. Asked for a break even analysis chart. Fed it clear fixed costs, variable costs, net operating income AND ROI percentages. Even hinted that the break even point was between years six and seven. Dude took five minutes to draw a line across the "0" plane labeled "costs" and a revenue line crossing through where I suggested the break even point is. The scale was between 0.2-1.6 USD. No, I am not running a business for ants.
-
-
 Your strategic advisor for business management decisions and insights.Open
 -
 Optimize your business with our Data Analytics tool.Open
 -
 Expert in explaining data visuals for academic publishing.Open
 -
 Your Power BI assistant for dataset creation, DAX, report review, design, and more.Open
 -
 Open
Open -
 Extract LabCorp blood work into google sheets effortlessly.Open
 -
 Technical expert on Data Visualization and database integrationOpen
 -
 Open
Open -
 Open
Open -
 Open
Open -
 Expert in analyzing UK theses data without subject infoOpen
 -
 Create 'Fool Around/Find Out' line charts for your plans.Open
 -
 Guides in choosing the right business data visualizations.Open
 -
 Secure, innovative GPT for collaborative data science and education.Open
 -
 Advanced epidemiology expert with AI-driven data integration and dynamic visualization tools.Open
 -
It only provides an overview no details of gamrs
-
 Expert in UK postgrad theses in philosophy, psychology, religious studies.Open
 -
 Advanced assistant for data publication and integration.Open
 -
 Automatically tile all professionals and equipment.Open
 -
 Your Expert in Microsoft Teams Communication AnalysisOpen
 -
 Transforms your pee times into insightful graphs.Open
 -
 Expert in UK Sport & Recreation Theses with Enhanced DataOpen
 -
 Open
Open -
 Monitoring tools expert with brief responses and guiding hints.Open
 -
 Expert in Veterinary Medicine theses and dissertations in Brazil.Open
 -
 Open
Open


Post


