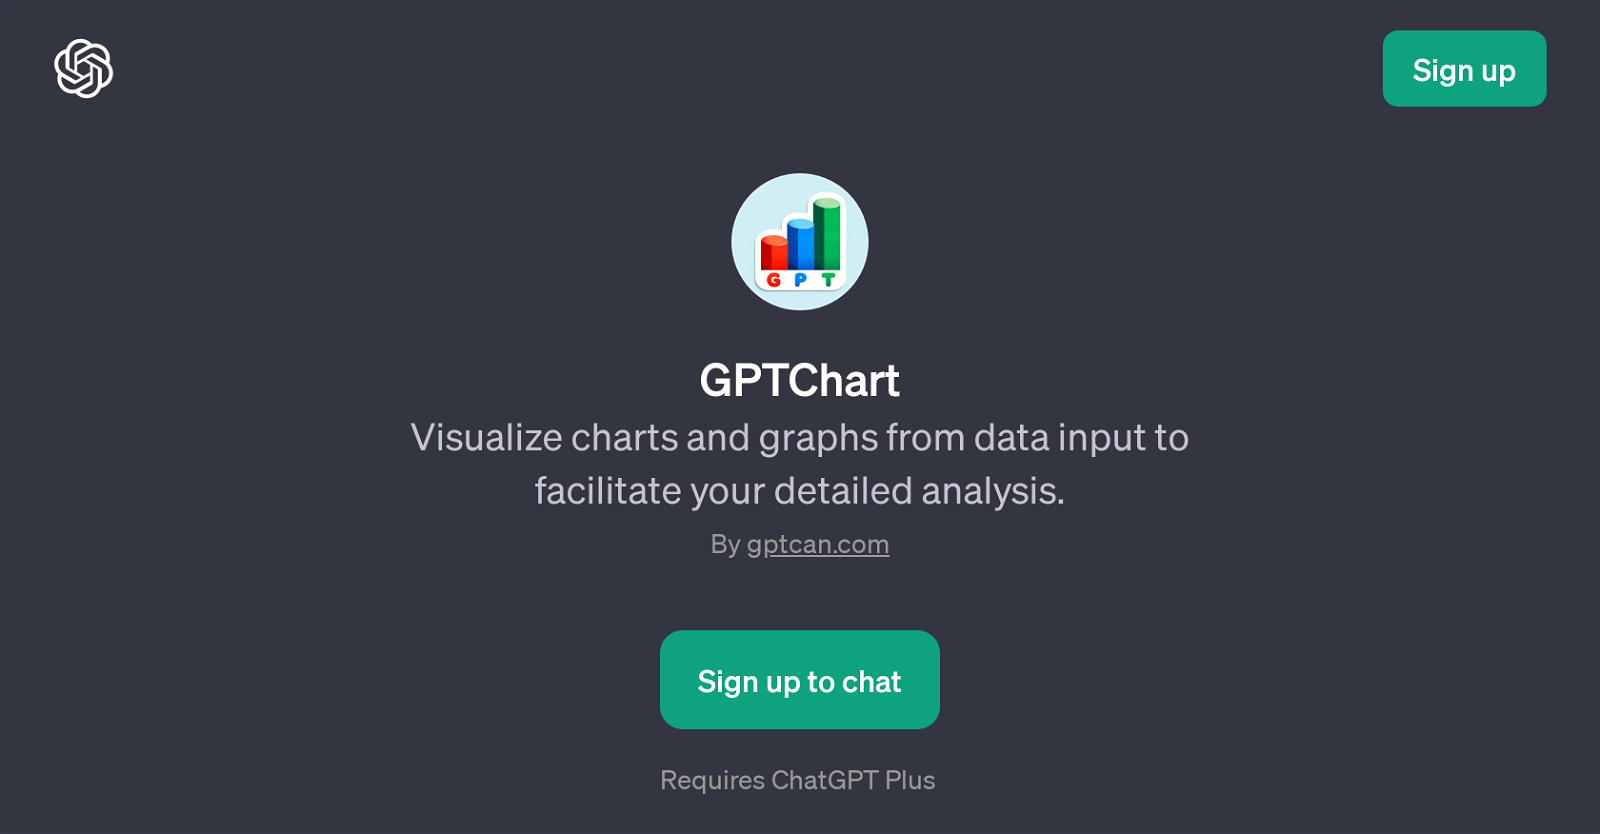
GPTChart is a Generative Pre-trained Transformer (GPT) developed by gptcan.com with a specific focus on data visualization. It is designed to accept data inputs from the user to subsequently generate and visualize charts and graphs, thus aiding in detailed and insightful data analysis.
This tool operates within the ChatGPT environment and is therefore, required to have ChatGPT Plus.GPTChart can be particularly helpful in providing visual context to large datasets, making it easier for users to interpret complex information, uncover patterns, and draw conclusions.
The types of charts supported by the tool include, but are not limited to, various Excel chart types. The tool is capable of constructing these visualizations from data provided directly by the user or from files sourced as per users instructions.
One of the standout features of GPTChart is its interactive user assistance. Upon launching, the tool displays a welcoming message, offering help with data visualization.
It guides users with prompt starters; for instance, it asks for the file and corresponding field name to begin the data visualization process. Additionally, if the user does not have a file at hand, GPTChart offers to find the required file itself according to the details provided by the user.
In summary, GPTChart is a GPT that facilitates data representation through charts, enabling users to conduct a comprehensive, nuanced analysis of the information.
Would you recommend GPTChart?
Help other people by letting them know if this AI was useful.
Feature requests



31 alternatives to GPTChart for Data visualization
-
4.5502
-
34
-
5.0293
-
27
-
17
-
11
-
111
-
 8
8 -
7
-
5
-
 4184
4184 -
3
-
 3
3 -
 316
316 -
 322
322 -
 37
37 -
 115
115 -
 1100
1100 -
Technical expert on Data Visualization and database integration11
-
 100
100 -
 105
105 -
 Guides in choosing the right business data visualizations.
 -
 Automatically tile all professionals and equipment.11
 -
 10
10 -
-
 13
13 -
 Create 'Fool Around/Find Out' line charts for your plans.9
 -
 19
19 -
 97
97 -
 17
17 -
 11
11
If you liked GPTChart
Featured matches
Other matches
-
5.083
-
5.094
-
5.0792
-
13
-
4.5502
-
1
-
2
-
412
-
432
-
32
-
310
-
41
-
3787
-
4
-
3
-
28
-
80
-
19
-
121
-
352
-
2181
-
104
-
3863
-
26
-
7
-
38
-
44
-
272
-
40
-
2354
-
130
-
188
-
9
-
320
-
4118
-
19
-
168
-
5
-
2400
-
8
-
130
-
1
-
1
-
3
-
3
-
21
-
1
-
5
-
1
-
1.01081
-
18
-
7
-
5.08175
-
4.01673
-
2
-
16
-
9
-
66
-
5.061
-
5.0626
-
3
-
2
-
8
-
2
-
5.0161
-
5.014
-
5
Help
To prevent spam, some actions require being signed in. It's free and takes a few seconds.
Sign in with Google


