 14,919
LIDA
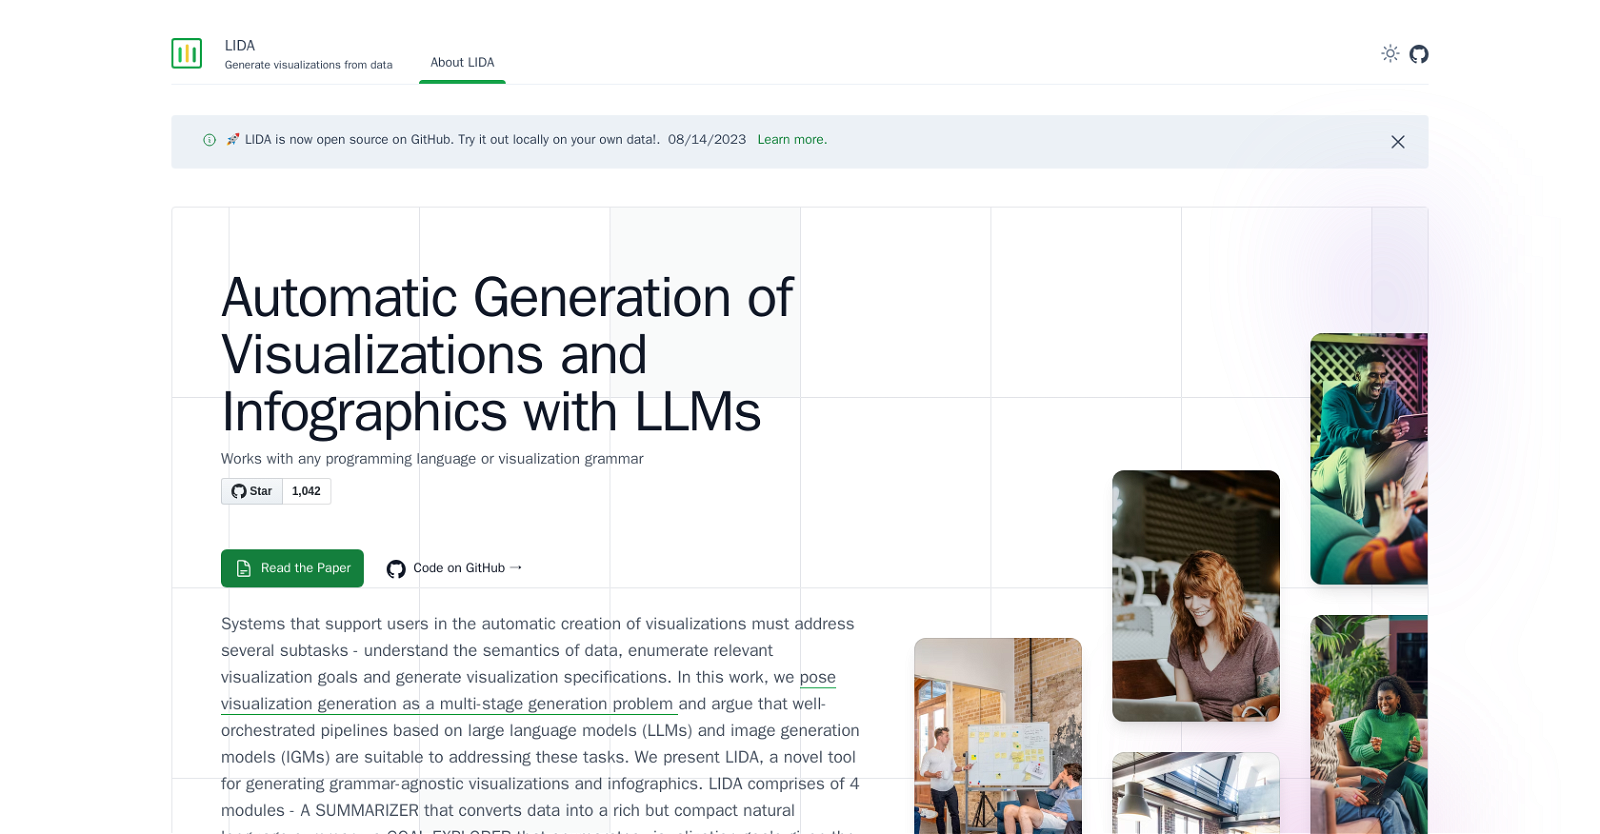
LIDA is a powerful tool that automates data exploration and generates visualizations and infographics using large language models (LLMs) like ChatGPT and GPT4.
It provides a conversational interface for automatic generation of grammar-agnostic visualizations from data. LIDA consists of four modules: the Summarizer, which converts data into a compact natural language summary; the Goal Explorer, which enumerates visualization goals based on the data; the VisGenerator, which generates, refines, executes, and filters visualization code; and the Infographer, which produces data-faithful stylized graphics using image generation models.LIDA is compatible with any programming language or visualization grammar, allowing users to create visualizations in Python (e.g., Altair, Matplotlib, Seaborn), R, C++, and more.
It also offers operations on existing visualizations, such as visualization explanation, self-evaluation, automatic repair, and recommendation.The tool supports various capabilities, including data summarization, automated data exploration, grammar-agnostic visualizations, and infographics generation.
It leverages the language modeling and code-writing capabilities of LLMs, enabling core automated visualization capabilities. LIDA also provides operations on generated visualizations, such as visualization explanation, self-evaluation, visualization repair, and visualization recommendations.LIDA's architecture combines LLMs and image generation models (IGMs) to address the multi-stage generation problem of visualization creation.
It is open-source and offers a Python API and a hybrid user interface for interactive chart, infographic, and data story generation.While LIDA has limitations with visualization grammars not well-represented in the LLM's training dataset and performance variations depending on the choice of visualization libraries and code generation capabilities, it remains a powerful tool for automating the visualization generation process.
How would you rate LIDA?
Help other people by letting them know if this AI was useful.
Feature requests

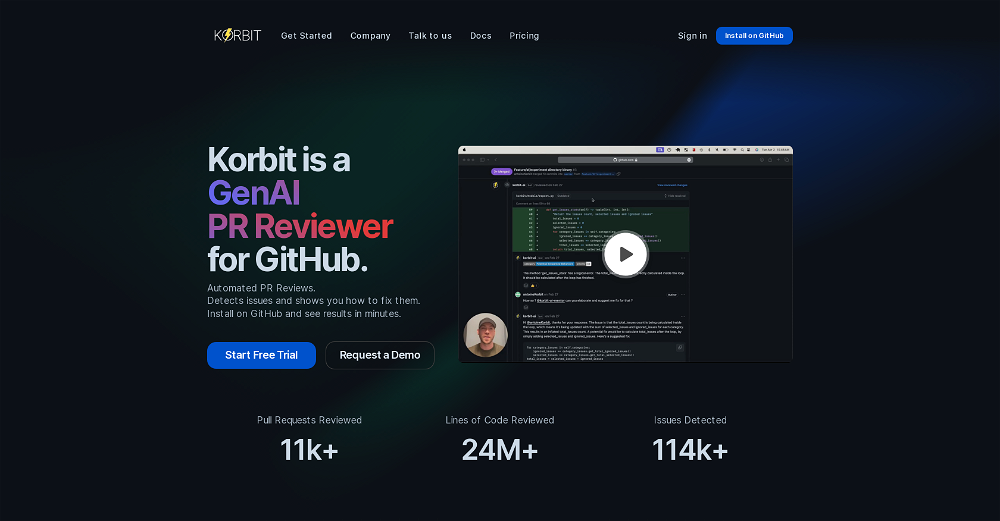
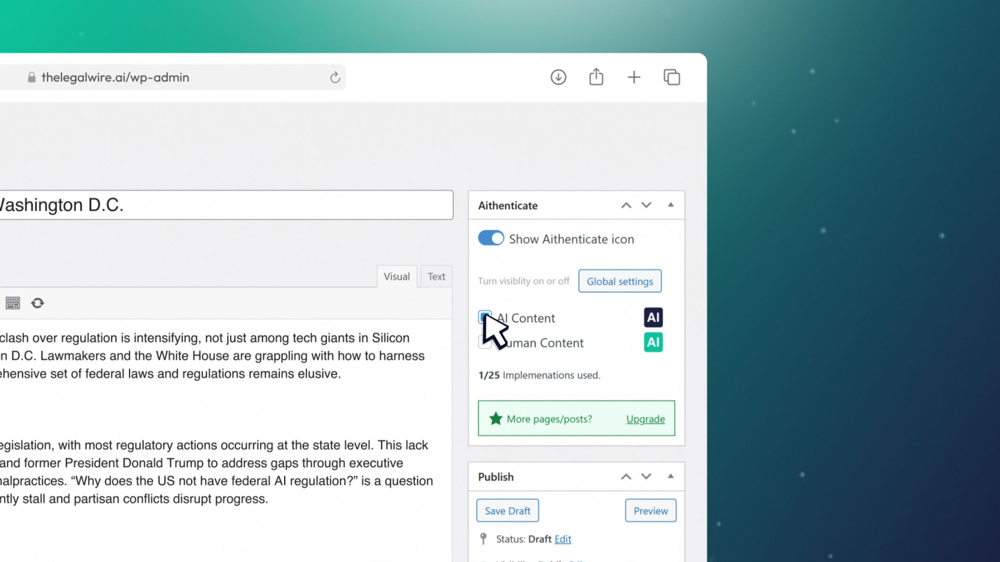
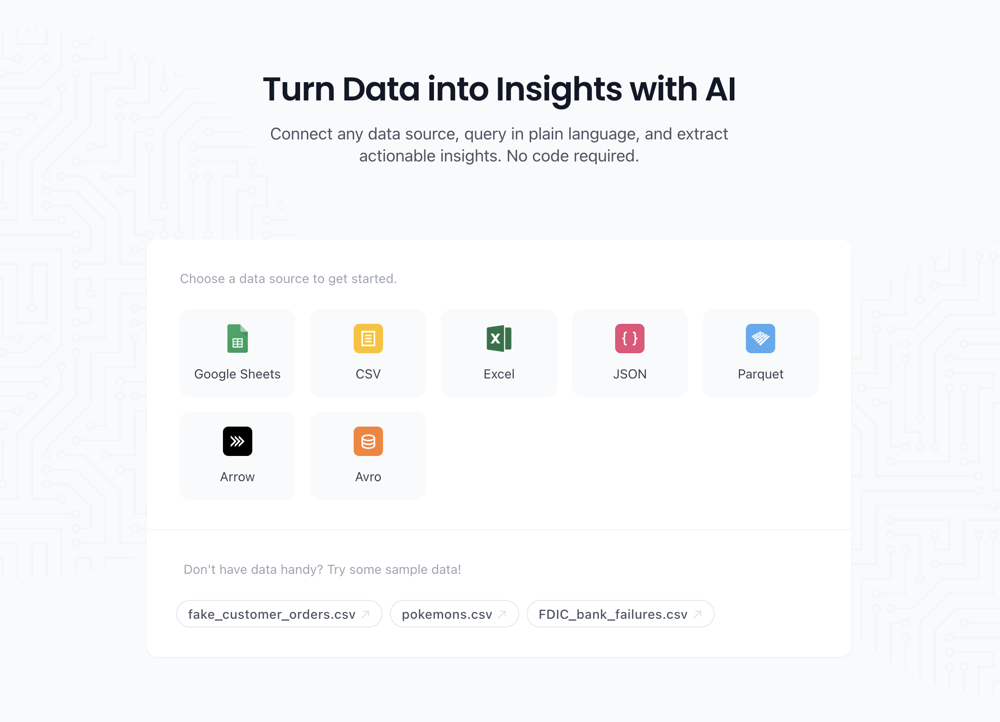
33 alternatives to LIDA for Data visualization
-
 562
562 -
 444
444 -
 412153
 -
 38
38 -
 28
28 -
 20
20 -
 18
18 -
 14
14 -
 11
11 -
 111
111 -
 9
9 -
 7
7 -
 5
5 -
 47
47 -
 4184
4184 -
 322
322 -
 3
3 -
 316
316 -
 2100
2100 -
 1
1 -
 Technical expert on Data Visualization and database integration11
 -
 115
115 -
 19
19 -
 17
17 -
 Create 'Fool Around/Find Out' line charts for your plans.9
 -
 100
100 -
 11
11 -
 97
97 -
 Guides in choosing the right business data visualizations.
 -
 13
13 -
 10
10 -
 105
105 -
 Automatically tile all professionals and equipment.11


Pros and Cons
Pros
Cons
Q&A
If you liked LIDA
Featured matches
Other matches
People also searched

Subscribe to our exclusive newsletter, coming out 3 times per week with the latest AI tools. Join over 470,000 readers.
Help
To prevent spam, some actions require being signed in. It's free and takes a few seconds.
Sign in with Google

