Go to section
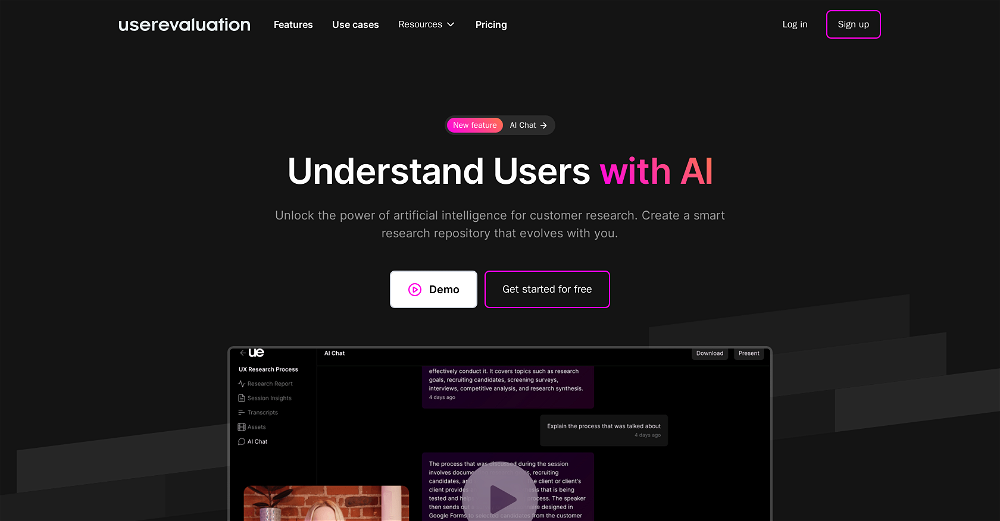
Spotlight![]() SureThing.io - "OpenClaw" for BeginnersTask automation
SureThing.io - "OpenClaw" for BeginnersTask automation
The front page of AI.Used by 90M+ humans.

TAAFT Tutorial
Generate image
Tasks
Generate text
Free mode
Trending
Leaderboard
Characters
 Mini tools
New
Featured
Lists
Agents
Requests
Jobs
Map
Newsletter
Starter pack
Free tools
Speech to text
Text translator
Remove background
Settings
Edit profile
My tools
Gallery
Dashboard
Inbox
Get featured
Contact TAAFT
For you
Popular
Job impact index
Most saved
Affiliate program
Submit AI tool
Notification preferences
Glossary
Home
Timeline
My profile
Create tool
Deals
Companies
Models
Robots
Papers
Fundraises
Repositories
Devices
Organizations
Events
Prompt Pack
Merchendise
APIs
Features
Tools
Countries
Collections
Videos
Mini tools
New
Featured
Lists
Agents
Requests
Jobs
Map
Newsletter
Starter pack
Free tools
Speech to text
Text translator
Remove background
Settings
Edit profile
My tools
Gallery
Dashboard
Inbox
Get featured
Contact TAAFT
For you
Popular
Job impact index
Most saved
Affiliate program
Submit AI tool
Notification preferences
Glossary
Home
Timeline
My profile
Create tool
Deals
Companies
Models
Robots
Papers
Fundraises
Repositories
Devices
Organizations
Events
Prompt Pack
Merchendise
APIs
Features
Tools
Countries
Collections
Videos

▼ State of the art
Ai visualization
Free mode
100% free
Freemium
Free Trial
Other tools
-
 Cherry🙏 14 karmaApr 11, 2026@VidFlux AI Image EditorI like it but sometimes it changes some features in somone
 -
Apologies for the delayed response. Let me clarify our free tier benefits: 1.Daily Quick Credits: Free users receive 2 quick generation credits every day. 2.Unlimited Standard Generation: You can generate an unlimited number of images daily. Please note that during peak usage times, generation speeds may be slower to accommodate high traffic. 3.Advanced Features: Free users also have access to our excellent face-swap feature. 4.Our platform features the leading Nanobanana series models, supports various LoRA effects, and includes tools for background removal and image outpainting/expansion. 5.We welcome you to try them out! Regarding your question about pricing: The core features mentioned above are genuinely free. The 'pricing' structure you saw likely refers to optional paid plans for users who need faster speeds during peak times, higher priority, or additional commercial features. It is not 'free after you pay,' but rather a free base service with optional upgrades. We hope this clears up any confusion!"
-
- Spotlight
 SureThing.io - "OpenClaw" for BeginnersTask automation
 -
-
 Boost your creativity with AI-powered brainstorming.Open
 I can't explain how impressed i am by this. I've seen tools to help you brainstorm ideas, but not one to break your task down into big steps, then little steps for each of these. Plus "games" to help come up with more ideas for your project. I'm excited to use this!
 -
 Open
Open -
-
 Thanks for your feedback! We are also shipping some exciting new features this month!
 -
 This is truly a wonderful experience that brings joy and delight.
 -
 The Agent is really handy. It's much more streamlined and convenient than canvas-based AI tools. There's a bit of a learning curve at the start, but once you get the hang of it, it's incredibly useful
 -
GoAI turns market noise into transparent, actionable investment logic. Go check your favorite stock for an instant deep-dive and see what the AI reveals. Feedback welcome!
- Didn't find the AI you were looking for?
-
If you don't offer any free trial credits or at least show videos without a watermark, no one will feel confident enough to purchase credits without testing it first. People need to verify the quality before committing to a purchase.
-
-
👋 Hey, I'm the founder of Flowova! We built this because we were tired of spending hours dragging boxes in traditional flowchart tools. A few things you might not know: - Works with anything — text, images, PDFs, Word, PPT, Excel, even photos of whiteboard sketches - 40+ themes designed for presentations - Full Mermaid code support for developers Happy to answer any questions! 🚀
-
 Generate AI images. No subscription. Credits never expire.OpenImproved page interactions for a smoother and more intuitive user experience. Added support for the latest Nana Banana 2 Lite and MJ V8.1 image models, now available with a free trial. We're still keeping it simple—no subscription required. Pay only for what you use.
 -
I felt there is need of more ready made templates. But, it does what it claims. I chose one question suggested by the AI agent, and it created the infographics in few seconds. It's cool. Saving it for future reference.
-
Image3D feels like a practical tool rather than just a demo. The workflow is simple, the preview loads in-browser, and I can export common formats like GLB, OBJ, STL, and PLY. I would recommend it for fast 3D asset drafts and 3D printing experiments.
-
Didn't really do the graphs that i thought it would do. Good for simple graphs, like for a presentation
-
Scrollsequence is a game-changer for interactive storytelling! Smooth animations, intuitive setup, and impressive control over scrolling sequences make it perfect for engaging web experiences. Highly recommend for designers and developers looking to elevate their sites. 🙌
-
 Make Better Decisions with Data-Driven Charts, Clear Explanations, and Insightful AnalysisOpen
 -
I was just trying to get a quick graph showing population evolution over the last 30 years, didn’t have the dataset ready, so I was hoping the tool could auto-fill something reasonable. But it literally gave me three values. Three?? For 30 years?? What kind of trend can I possibly see with that? If the tool offers to research the data, it should at least offer a full timeline. And when I pasted the data I found, it created a literally bar chart???
-
I’d say this is one of the best chatbots I’ve used so far. The side-by-side comparison view is super handy for spotting bias and made-up, and the custom bots actually have decent memory, which is rare. Just a heads up: no image generation or voice mode. Other than that, it’s pretty solid.
-
Created a dashboard using my Excel file and it gave insights I didn’t even expect. It can read any kind of Excel file no matter the template. I can even check the accuracy by tracing back which column the data came from Great tool. highly recommended!!
-
-
 OpenReally great number pattern generator. We have taken your tool and made some advanced changes here - https://texttoolz.com/tools/number-pattern-generator
 -
Poor images. Not even come closer to the ask
-
I'm absolutely blown away by the design quality of the presentations they look so vibrant and stylish. I was also pleasantly surprised that the AI asks lots of clarifying questions to make sure the final result is exactly what I wanted, not just something random. Vibes 🔥
-
 Stand out and win more clients with personalised AI recommendationsOpen
 -
 Create on-brand image and video ads in minutesOpen
 -
 Turn notes into perfect infographics from 500+ designs.OpenHi TAAFT! I'm Henry, the founder of CartoMind. CartoMind offers a fully automated AI workflow to help you quickly organize text content and generate the perfect infographics to match. 【Why did I build this?】 When creating infographics with AI today, users are often forced to choose between two extremes. You either use generic AI image SaaS tools that trap you in complex prompt engineering and steep design learning curves with zero knowledge management, or you use products like NotebookLM. While they are fantastic for knowledge management, their infographic generation is just an afterthought, lacking design freedom and rich templates. 【Here is where CartoMind stands out:】 1. Lightweight knowledge & note management: We support uploading multiple file formats and automatically parsing text, allowing you to freely select the exact knowledge snippets you want to visualize. 2. Fully automated workflow: Based on your selected content, our AI automatically distills the key text elements and instantly matches you with the ideal infographic design from over 500 professional combinations. 3. Massive template library: A rich selection of infographic templates offering a true what-you-see-is-what-you-get experience. 【Who is using it?】 Marketers, educators, social media creators... In fact, anyone who needs to make their domain knowledge "visible" and loves to share it will find it incredibly useful. 【I can't wait for you all to try it out!】
 -
-
 Open
Open -
 Open
Open -
RenderCAD has been such an incredible asset to my company, At Home By Design. We specialize in both commercial and residential design, and their renderings have truly brought my visions to life. The level of detail, professionalism, and presentation has been beyond impressive.
-
 Open
Open -
I really gotta let my heart out, got so many great reviews from my peers. It has helped me make my school work so much easier. I work with little children so when i make it cartoonish it's giving me the best one's yet.
-
Steer clear of this by any cost ! it gives you ONE video for free and then ask you for no less than FIFTY dollars a month for only FIVE videos ! they must be crazy with all the alternatives.
-
Viz makes the process of turning data into dashboards feel much simpler and more natural. Being able to upload or connect data, ask questions in plain language, and quickly get interactive visualizations is genuinely useful, especially for people who do not want to spend hours building dashboards manually. What I like most is that Viz feels focused: it is not just an AI chat tool, but a product designed to help users move from raw data to clear, shareable insights. Overall, it looks like a practical and intuitive tool for making data analysis faster and more accessible.
-
One thing we kept noticing with AI music: Great songs were being generated… but most of them still looked like demos when shared online. We built LyricMV to help turn AI-generated music into something that actually feels publishable — cinematic lyric videos with synced visuals, emotional pacing, and short-form friendly formats. Would love feedback from the AI music community 👀
-
 Open
Open -
 Turn architectural sketches into photorealistic renders in seconds.Open
 -
 AI-powered scientific illustration and data visualization platform.Open
 -
-
-
Gardenly lets me quickly iterate on my garden design. A great way to get inspired!
-
 Visualize scientific concepts with AI-generated imagery.Open
 -
 Transform text into surreal pen-and-pencil sketches with watercolor washes.Openhmmm yeah great, i'm sure i could also recreate these in real life, with pencils
 -
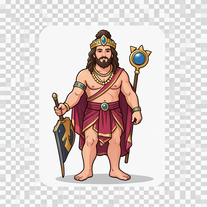
 AI-generated Indian deity avatars blending tradition with modernity.Open
 -
 AI-powered microscope for ultra-realistic nano-visuals.Open
 -
 Transform molecular visualization requests into precise PyMOL commands.Open
 -
 Transform dream home ideas into stunning architectural visualizations.Open
 -
 AI crafts realistic, family-friendly portraits of Greek deities.Open
 -
Dumber than a box of hair. Asked for a break even analysis chart. Fed it clear fixed costs, variable costs, net operating income AND ROI percentages. Even hinted that the break even point was between years six and seven. Dude took five minutes to draw a line across the "0" plane labeled "costs" and a revenue line crossing through where I suggested the break even point is. The scale was between 0.2-1.6 USD. No, I am not running a business for ants.
-
 Converting Python code into illustrative diagrams.OpenI like how it gives both PlantUML and Mermaid code, as I found that the Mermaid graph TD code would sometimes not work in the Mermaid Live Editor.
 -
 Your guide to creating dynamic music visualizers!Open
 -
 Expert in explaining data visuals for academic publishing.Open
 -
 A software architect for C4 Model generation.Open
 -
 Technical expert on Data Visualization and database integrationOpen
 -
 Innovative visual creator with interactive idea selection.Open
 -
 Guides in choosing the right business data visualizations.Open
 -
 Open
Open -
 Open
Open -
 Creative assistant for storyboard visualization from video briefs.Open
 -
 Playfully creates realistic Lego Box Set images using DALL-E.Open
 -
 Get a scatter plot of keyword rankings before and after updates.Open
 -
 Open
Open -
 Transforming ideas into clear flowcharts with tech stack recommendations.Open
 -
 Create your family constellation with DALL-E.Open
 -
 Visualizing and safeguarding your year's progress.Open
 -
 Automatically tile all professionals and equipment.Open
 -
 Create 'Fool Around/Find Out' line charts for your plans.Open
 -
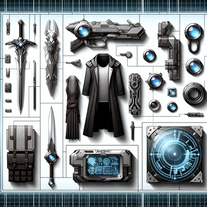 Visualize items for characters with photo-realistic images.Open
 -
 See products in a visual transition from intact to exploded views.OpenCan somebody try this tool and post a video and show how it works?
 -
-
 Open
Open -
 Creating visually compelling images of the future.Open
 -
 Creating detailed, magnified images with educational insights.Open
 -
 Open
Open


