

▼ Popular
Data visualization tool
Free mode
100% free
Freemium
Free Trial
Featured matches
-
 Wasel Alhodar🙏 72 karmaJul 15, 2025@InstantMindThis is truly a wonderful experience that brings joy and delight.
 -
 If you don't offer any free trial credits or at least show videos without a watermark, no one will feel confident enough to purchase credits without testing it first. People need to verify the quality before committing to a purchase.
 -
 It greatly supported my R&D work by helping me tackle technical challenges and prepare reports.
 -

-
-
 Says "free during testing," but keeps telling me I have insufficient credits. I also can't seem to find a way to delete my account.
 -

-

-
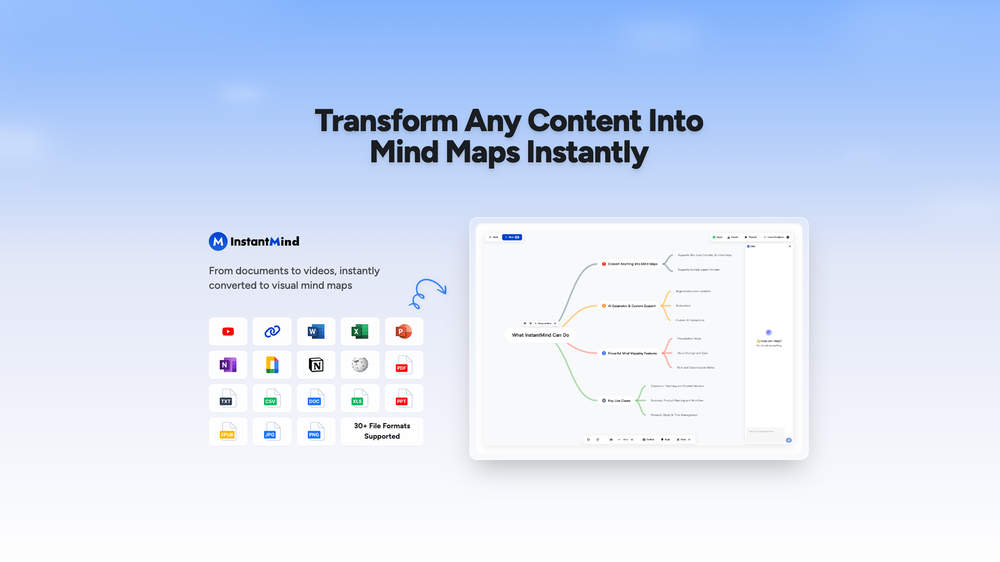
 👋 Hey, I'm the founder of Flowova! We built this because we were tired of spending hours dragging boxes in traditional flowchart tools. A few things you might not know: - Works with anything — text, images, PDFs, Word, PPT, Excel, even photos of whiteboard sketches - 40+ themes designed for presentations - Full Mermaid code support for developers Happy to answer any questions! 🚀


Other tools
-
It is the ease of use for me. DataSquirrel is fast, the UI is super intuitive, and the guided analysis feature is highly convenient. I have officially moved from uploading CSV files from Google sheet to DataSquirrel. Within minutes, I can visualize my data and interpreting it becomes super simple.
-
-
It took me less than 20 minutes to create infographic perfection- all the other AI design sites I tried, and I tried them all, weren't able to give me what I wanted in 1 way or another. Outline Ninja helped me create my infographic
-
- Sponsor:Rocket
-
Isn't it possible that when downloading a diagram from it, the diagram to have white background rather than black background.
-
-
I really value the sentiment analysis tool—it simplifies understanding customer feedback by picking up on their emotions. Plus, the way it groups comments into topics is super helpful for decision-making.
-
I had to tweak a few things to match my brand style, but overall it saved me a ton of time. Definitely handy if you need something fast and professional-looking.
-
-
asking for key, no usability without a paid subscription
- Didn't find the AI you were looking for?
-
Good to use even for free. Gives answers related directly to the info in the document, along with references to pages where it can be found. Also does well at analyzing graphs and charts
-
This has got a super-positive future. After creating just one video, I could see that there would be a large use-case for most industries, including mine with Online Marketing. One thing I did notice was that assets that appear on screen often overlap each other. The same was apparent on most of the other videos in their showcase. Once they get over this hurdle, it'll be worth paying for, for sure.
-
-
I really like DataLine, but I'm kinda biased cause I built it.
-
impressive :O quite easy to use and great designs overall
-
 Ask data questions, get instant insights, SQL, and charts — all poweredOpen
 -
-
Probably the most fun way to explore a topic, powered by GPT. Albus is a live board that will help you explore any topic you like in new ways, from different perspectives. Think of it as Google meets Pinterest.
-
I am able to summarize a complex paper into a one-pager visual. Before this tool: hours of reading and summarizing. After this tool: I grasp something complex in seconds. Thank you!!!
-
At the moment it works for me, perhaps try again?
-
-
-
 AI-powered paper writing in 2 minutes: bypass-AI, plagiarism-free, well-researched.OpenThe site is easy to use and has nice features (it suggests titles - it divides the search in a good way, making you choose the number of words you want to write in the search), but the problem is that it writes paragraphs without footnotes and without a list of references.
 -
-
-
Takes input (full presentation text in my case) as prompt and generates its own copy. Poor image quality. Boring layout. No bullets etc. You can try once with your free credits. no fun
-
Looks promising but found it very slow to load and create templates and previews
-
It’s a powerful and intuitive tool that simplifies complex tasks, boosts productivity, and makes managing work smoother than ever. Highly recommended!
-
Displayr has become an essential tool for survey data analysis. By leveraging advanced AI integration, the platform offers a user-friendly, low-code solution for analyzing survey data. Users can efficiently create presentations while working on data analysis within the same interface, eliminating the hassle of transferring numbers from Excel to PowerPoint.
-
I felt there is need of more ready made templates. But, it does what it claims. I chose one question suggested by the AI agent, and it created the infographics in few seconds. It's cool. Saving it for future reference.
-
-
Great tool for getting some initial information about your data, especially in the beginning phase when your main goal is to explore your data
-
I was just trying to get a quick graph showing population evolution over the last 30 years, didn’t have the dataset ready, so I was hoping the tool could auto-fill something reasonable. But it literally gave me three values. Three?? For 30 years?? What kind of trend can I possibly see with that? If the tool offers to research the data, it should at least offer a full timeline. And when I pasted the data I found, it created a literally bar chart???
-
-
-
The conversation with the ai felt really nice. And the even the narrative part is well executed.
-
Such a powerful tool with free account, all your data analysis needs with an easy intuitive itnerface
-
Data narration and augmentation are valuable tools from datumfuse.ai
-
I got some free credits to try the app when I signed up, I could create a few great infographics
-
As a tattoo nerd who cares about solid guidance and clean cover-ups, this one is a surprisingly good jump-ogg. Great for "what can I make here" and getting three or four workable angles to bring to the shop.
-
 Generate stunning AI images of futuristic musical idols.Open
 -
 Bring history to life with AI-generated visualizations.Open
 -
 Generate ultra-realistic satellite images with professional detail.Open
 -
 Transform molecular visualization requests into precise PyMOL commands.Open
 -
Dumber than a box of hair. Asked for a break even analysis chart. Fed it clear fixed costs, variable costs, net operating income AND ROI percentages. Even hinted that the break even point was between years six and seven. Dude took five minutes to draw a line across the "0" plane labeled "costs" and a revenue line crossing through where I suggested the break even point is. The scale was between 0.2-1.6 USD. No, I am not running a business for ants.
-
It literally told me it couldn’t create maps, and directed me to Mapbox.
-
-
 Refines articles into summaries and mind maps.Open
 -
 Open
Open -
 Your Power BI assistant for dataset creation, DAX, report review, design, and more.Open
 -
 Get a scatter plot of keyword rankings before and after updates.Open
 -
 Especialista em teses e dissertações de Engenharia CivilOpen
 -
 Open
Open -
 Create 'Fool Around/Find Out' line charts for your plans.Open
 -
 Especialista em teses de Engenharia de Transportes do BrasilOpen
 -
 Especialista em teses de Probabilidade e EstatísticaOpen
 -
 Advanced assistant for data publication and integration.Open
 -
 Transforms your pee times into insightful graphs.Open
 -
 Expert in UK postgrad theses in philosophy, psychology, religious studies.Open
 -
 Open
Open -
 Expert in UK Sport & Recreation Theses with Enhanced DataOpen
 -
 Monitoring tools expert with brief responses and guiding hints.Open
 -
 Assisting in evaluating protein engineering tools.Open


Post


