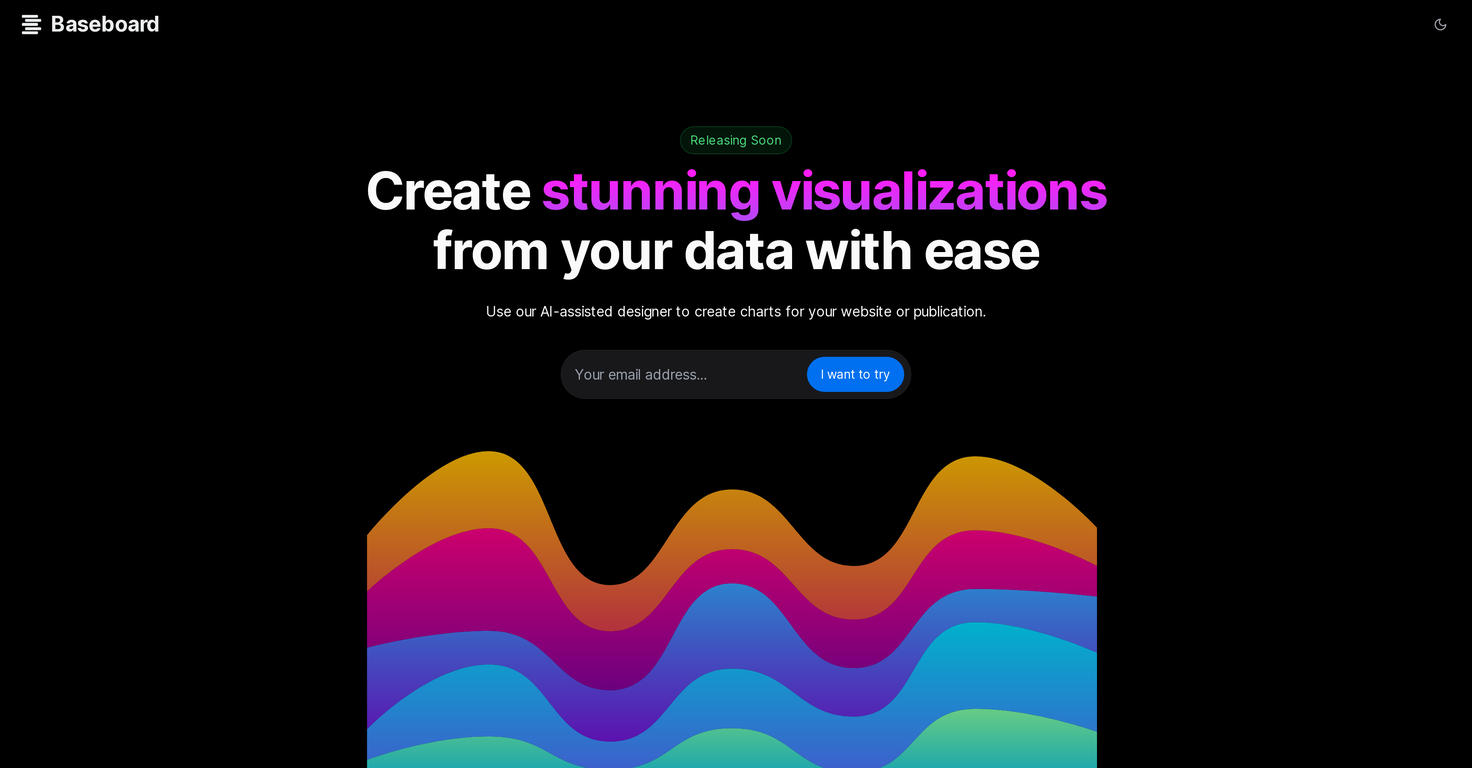
What is Baseboard?
Baseboard is an AI-powered data visualization tool. It assists users in transforming their data into actionable insights. The tool is oriented towards data analysts, product managers, entrepreneurs, and professionals requiring clear, data-driven decision-making.
How does Baseboard use AI for data visualization?
Baseboard uses AI to aid in the creation of extensive visual insights. It is powered by natural language processing technology, enabling users to interact with their databases using plain English, thus making data querying less complex and more intuitive.
Who is Baseboard designed for?
Baseboard is designed for a diverse range of individuals, particularly targeting professionals like data analysts, product managers, and entrepreneurs, who seek to make data-driven decisions.
Does Baseboard offer a customizable dashboard?
Yes, Baseboard offers a fully customizable dashboard. It allows users to display their data in visually appealing ways through graphs and charts.
How does Baseboard handle data query?
Baseboard uses natural language processing technology, which facilitates users to query their databases using everyday language, in turn eliminating the need for complex queries or coding knowledge.
What integrations are available with Baseboard?
The specific integrations available with Baseboard are not directly provided on their website. However, it's mentioned that the tool integrates with a variety of data sources, suggesting a robust capability for data integration from different platforms.
Does Baseboard have team collaboration features?
Yes, Baseboard features team-friendly dashboards that make collaboration and sharing of insights with team members easy. This aims to promote teamwork and increase productivity.
Is there an AI-assistant available in Baseboard for creating visualizations?
Yes, Baseboard provides an AI-assistant designer, which assists users in creating detailed and visually appealing visualizations for their data.
How can I use Baseboard for data-driven decision making?
Baseboard facilitates data-driven decision making by converting raw data into actionable insights, which are intuitive and comprehensive. This enriched data can then be utilized for making informed choices.
How does Baseboard help in identifying trends?
Baseboard aids in identifying trends by providing powerful visualization tools. These tools allow users to create custom visual insights, helping them to unmask underlying trends, patterns, and insights in their data.
Can I create my own graphs and charts with Baseboard?
Yes, Baseboard allows for the creation of personalized graphs and charts. Users can make use of the AI-assisted designer to design visually appealing graphs and charts that best depict their data.
What makes Baseboard stand out in terms of data presentation?
Baseboard emphasizes the presentation of data, ensuring it is friendly and digestible. This is achieved through visually appealing and comprehensible dashboard designs and data visualizations that speak directly to the viewer.
Can I share my dashboards with my team on Baseboard?
Yes, Baseboard allows users to share dashboards with their team members, fostering collaboration and unification among the team.
What data sources can Baseboard integrate with?
Baseboard can integrate with numerous data sources, facilitating straightforward data integration. However, the specific data sources it integrates with are not outlined on their website.
How does Baseboard help in understanding complex data?
Baseboard helps in understanding complex data by transforming it into visually appealing, digestible insights. It achieves this through powerful visualization tools, creating comprehensible graphs and charts.
Is Baseboard suitable for non-coders as well?
Yes, Baseboard is suitable for non-coders, due to its natural language processing technology. Users can interact with their databases and create complex queries using plain English, without requiring coding knowledge.
What measures does Baseboard take to enhance productivity?
Baseboard enhances productivity through team-friendly dashboards, fostering collaboration and insight sharing. Its ability to transform raw data into actionable insights expedites decision-making processes, thereby boosting productivity.
Can Baseboard visualize data for websites or publications?
Yes, Baseboard can create striking visualizations for websites or publications. This is made possible through its AI-assisted designer.
How does Baseboard facilitate the data interpretation process?
Baseboard enhances the data interpretation process by providing clear and poignant visual representations of data, assisting professionals in identifying underlying patterns, trends, and insights more quickly and efficiently.
What level of customization does Baseboard offer for dashboard design?
Baseboard offers extensive customization for dashboard design. Users can tailor their dashboards to suit their needs using visually appealing graphs and charts, enhancing comprehension of data and adding a personal touch to their data interpretation process.

 494
494 452153
 28
28 22
22 16
16 11
11 11
11 111
111 9
9 8
8 7
7 6184
6184 5
5 47
47 416
416 3100
3100 3
3 322
322 119
119 1
1 Technical expert on Data Visualization and database integration11
 115
115 1105
1105 Create 'Fool Around/Find Out' line charts for your plans.9
 17
17 100
100 11
11 Automatically tile all professionals and equipment.11
 97
97 Guides in choosing the right business data visualizations.
 13
13 10
10