Data visualization
2024-03-06
AI-Powered Data Visualization in 0.32 seconds.
Overview
Data visualization#4 most recent
Most popular alternative: GPTChart (45 saves)
View all 32 alternatives
Recommendations
Generated by ChatGPT
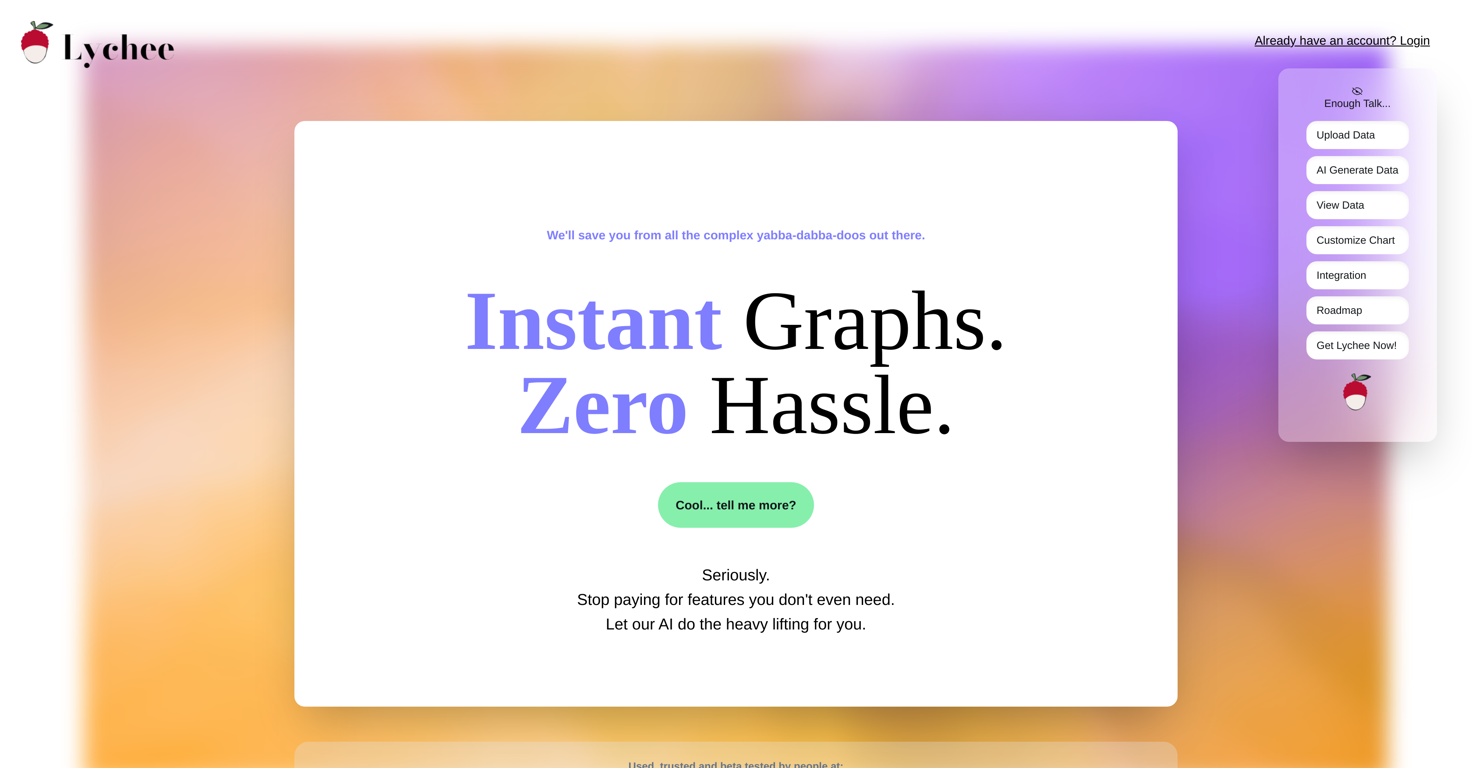
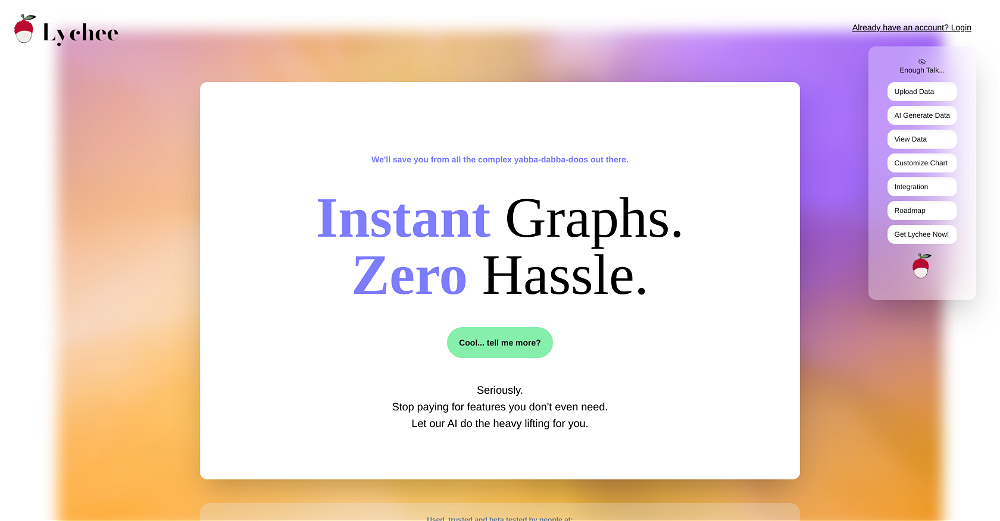
Experience the future of data visualization with Lychee, where AI meets simplicity.Tired of all these complex tools in the market when you’re just looking to turn your spreadsheets into graphs? We got you. No complex BS features you have to pay for, no coding skills, no high-tech language. Just your spreadsheets turning to graphs before you open your eyes.
What’s up, TAAFT community?
I’m an entrepreneur who focuses on solving the simple problems that others provide too much fluff solutions for.
And that’s how I came up with Lychee.
Lychee was born from a simple realization.
The world of data visualization needed a breath of fresh air. As someone who navigated and used other tools, I understand the frustrations and inefficiencies that often ask for a solution.
I built Lychee as a response to the clutter, the unnecessary complications.
Think of it for a second.
Why should you pay a lot of your hard-earned money for features that you don’t even use?
Why should you go to a platform that’s reserved for the people who know about coding?
Why should you look for an AI instant graph generator that doesn’t even do the job?
Here at Lychee, we fuse the power of AI with the ease everyone deserves.
In a world drowning in complexity, Lychee stands as a testament to the beauty of simplicity.
Join us where graphs are instant, and complexities are a thing of the past.
Pre-order now for lifetime access before we move it to subscription pricing.
That’s our gift to our legendary customers.
47
4
How would you rate Lychee?
Help other people by letting them know if this AI was useful.
Comments(4)

Burnerbgbk1 Surname
May 11, 2024
Hello! I've been trying to unsubscribe from here, but I don't see the option.

Bernard
🙏 39 karma
Mar 6, 2024
It's like the chart editor i wish i had for the last 10 years. Love it
FYI devs, the Combination chart throws an exception

misterrpink
🛠️ 1 AI
🙏 1 karma
Mar 7, 2024
Thank you so much Bernard!
My dream is to make the whole charting flow, spreadsheet process as seamless as possible.
Fixes to the charts, and more charts coming very soon!
Bernard
🙏 39 karma
Mar 7, 2024
Know i know i'll check this out again later, gl in your work
Post
Feature requests
Are you looking for a specific feature that's not present in Lychee?
💡 Request a feature
Lychee was manually vetted by our editorial team and was first featured on March 5th 2024.

32 alternatives to Lychee for Data visualization
-
 452153
 -
 38
38 -
 28
28 -
 22
22 -
 16
16 -
 111
111 -
 11
11 -
 9
9 -
 7
7 -
 7
7 -
 5184
5184 -
 5
5 -
 47
47 -
 416
416 -
 3
3 -
 322
322 -
 3100
3100 -
 2
2 -
 119
119 -
 1
1 -
 Technical expert on Data Visualization and database integration11
 -
 115
115 -
 Create 'Fool Around/Find Out' line charts for your plans.9
 -
 17
17 -
 100
100 -
 11
11 -
 97
97 -
 13
13 -
 10
10 -
 Automatically tile all professionals and equipment.11
 -
 Guides in choosing the right business data visualizations.
 -
 105
105


Pros and Cons
Pros
No coding skills required
User friendly interface
Instant data visualization
Fast data processing
Variety of chart types
Cost effective solution
Caters to individuals and businesses
Effective for academic research
Perfect for marketing agencies
Eliminates unnecessary functionalities
Alternative to spreadsheets
Effective data analysis and visualization
Creates charts from uploaded data
Trusted by reputable companies
Customizable chart styles
Resource for data creation
Real-time chart generation
Dynamic chart options
Ability to export graphs
Good for students and researchers
Single purchase, lifetime access
No monthly subscription fees
Access to all current and future features
Lifetime offers including updates
Dedicated support team
Ideal for non-coders
Positive user reviews
Prepares data in a 'blink'
Cons
Limited chart types
Requires data upload
Lack of integration options
No API mentioned
No collaborative features
No mention of security
Reliance on spreadsheets
No analytics functionalities
No real-time data options
Unclear data import limitations
Q&A
What is Lychee designed for?
Lychee is designed to help with the visualization and analysis of data without the need for spreadsheets. It caters to individuals, businesses, academic researchers and marketing agencies who require a tool for quick and efficient data processing and visualization.
How does Lychee transform data into charts?
Lychee operates by taking user's data (either uploaded as spreadsheets or created within Lychee) and transforming it into a variety of insightful charts. The platform does it almost instantaneously, promising fast data processing and immediate visualization after upload.
What kind of charts can Lychee generate?
Lychee can generate a variety of chart types to cater to the user's preference and the nature of their data. These charts include pie, histogram, and bar charts, among others.
Do I need any coding skills to use Lychee?
No, you do not need any coding skills to use Lychee. Its user-friendly platform requires no coding skills or complex language, making it accessible and easy to use for anyone.
How can I upload my data to Lychee?
You can upload your data to Lychee by dragging that Excel sheet into the platform's upload box for instant processing. If you don't have a spreadsheet ready, Lychee offers the option to create your data directly on the platform.
Does Lychee have fast data processing?
Yes, Lychee assures fast data processing. With its 'Blink Of An Eye' Level Instant feature, it turns spreadsheets into graphs almost immediately saving the user valuable time.
How user-friendly is Lychee?
Lychee is highly user-friendly. It requires no coding skills and uses no complex language, making it easy for anyone to use. It allows users to upload their data or create it within Lychee and offers a choice of dynamic chart options.
Why is Lychee considered cost-effective?
Lychee is considered cost-effective because it aims to provide only necessary features, cutting costs associated with unnecessary functionalities. Users are not required to pay for features they don't need, making it a cost-effective solution for data visualization.
Can businesses and academic researchers use Lychee?
Yes, businesses and academic researchers can use Lychee. This platform caters to a variety of users that require data visualization, including businesses and researchers who need to visualize and analyze their data without needing to navigate complex data handling processes.
What makes Lychee a time-saving tool?
Lychee saves time by providing immediate data processing and visualization as soon as the user uploads their data. It instantly turns spreadsheets into visible data representations, so users never have to wait for their results.
Can Lychee help me with data analysis?
Yes, Lychee can help with data analysis. By transforming data into insightful charts, Lychee aids individuals, businesses, and researchers in understanding and deriving insights from their data.
What kind of data can I visualize with Lychee?
You can visualize any data that can be represented in chart format with Lychee. This includes data from spreadsheets or data created directly within Lychee, making it versatile for a variety of data types.
How does Lychee cater to marketing agencies?
Lychee caters to marketing agencies by making it easy to visualize and analyze data, which can aid in making data-driven marketing strategies. Furthermore, its cost-effective nature helps marketing agencies handle data without incurring high costs.
Why is Lychee considered an alternative to spreadsheets?
Lychee is considered an alternative to spreadsheets because it enables data visualization and analysis without needing to use them. Additionally, Lychee permits creation of data directly within the platform, eliminating the need for spreadsheet management altogether.
How can I customize charts in Lychee?
You can customize charts in Lychee by choosing from a palette of dynamic chart options. You have control over what type of chart you want to represent your data, allowing for customization according to your personal or organizational style and preference.
Does Lychee offer instant visualization of data?
Yes, Lychee offers instant visualization of data. It promises to transform spreadsheets into visual data representations almost immediately after upload. This quick visualization feature works to save users time.
Can I create data within Lychee without uploading a spreadsheet?
Yes, you can create data directly within Lychee without uploading a spreadsheet. This feature where no spreadsheet is required offers users the ease and flexibility to create their own data from scratch on the platform itself.
Who can use Lychee?
Lychee can be used by any individual, business, academic researcher, or marketing agency that requires quick and efficient data visualization and analysis. It's user-friendly and requires no coding skills, making it accessible to anyone regardless of tech familiarity.
Is there any difference in using Lychee with spreadsheets or without?
There is no noticeable difference in using Lychee with spreadsheets or without. Users can either upload their data in spreadsheet format for instant visualization or create their own data directly within Lychee.
Who are some notable users or testers of Lychee?
Lychee has been used, trusted, and beta-tested by individuals at recognized companies and institutions like JPMorgan, Goldman Sachs, Meta (previously Facebook), Apple and the Massachusetts Institute of Technology (MIT).
If you liked Lychee
Featured matches
Other matches
-
48
-
1551
-
6
-
30011
-
85
-
104
-
17
-
902
-
14
-
2
-
3
-
2
-
512
-
532
-
32
-
410
-
41
-
3787
-
4
-
13
-
28
-
80
-
19
-
221
-
652
-
2181
-
1104
-
5863
-
66
-
7
-
38
-
44
-
272
-
40
-
5354
-
130
-
388
-
9
-
320
-
6118
-
39
-
168
-
1
-
5
-
3400
-
8
-
130
-
1
-
1
-
3
-
4
-
22
-
4
-
14
-
1
-
13
-
9
-
61
-
282
-
621
-
9
-
1331
-
8
-
8545
-
602
-
1803
-
2
-
16
-
10
-
72
-
61
-
686
-
4
-
12
-
3
-
222
-
15
-
5
-
5
-
502
-
10
-
664
Didn't find the AI you were looking for? Post a request
Home
Search
My saved AIs
Free signup
Just Launched
Featured
Popular
Requests
Tasks
Timeline
Job Impact Index
Forum
Newsletter
Submit / Advertise

Join the biggest AI community
Subscribe to our exclusive newsletter, coming out 3 times per week with the latest AI tools. Join over 470,000 readers.
Help
⌘ + D bookmark this site for future reference
⌘ + ↑/↓ go to top/bottom
⌘ + ←/→ sort chronologically/alphabetically
↑↓←→ navigation
Enter open selected entry in new tab
⇧ + Enter open selected entry in new tab
⇧ + ↑/↓ expand/collapse list
/ focus search
Esc remove focus from search
A-Z go to letter (when A-Z sorting is enabled)
+ submit an entry
? toggle help menu
Sign in to continue (100% free)
To prevent spam, some actions require being signed in. It's free and only takes a few seconds.
Sign in with Google


0 AIs selected
Clear selection
#
Name
Task