

▼ Most saved
Visualization
Free mode
100% free
Freemium
Free Trial
Featured matches
-
 Poojitha Bandaru🙏 8 karmaDec 26, 2025@ColumnsUI Experience is fast & good with free account limited data (100 csv records) but no 3rd party integrations and limited data connection and no 3D /funnel many more chart visualizations are missing.
 -
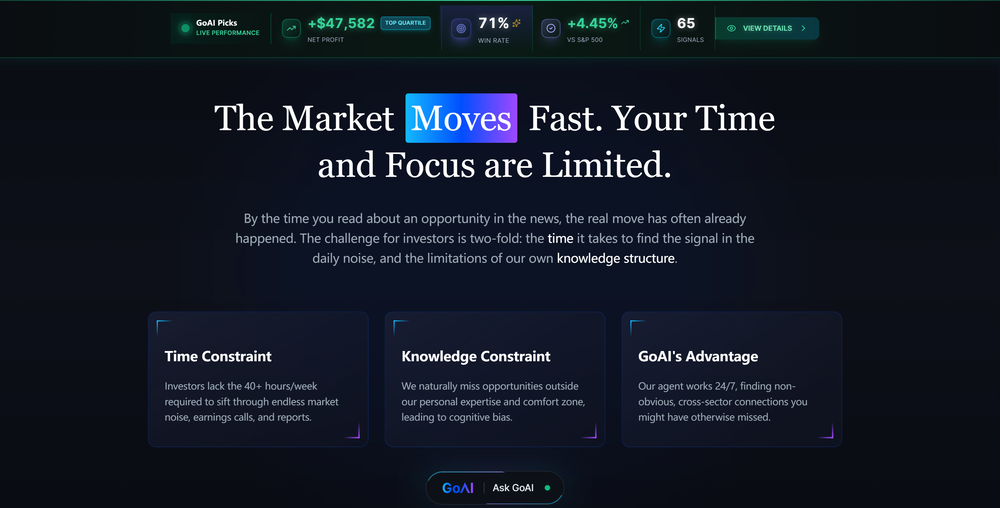 GoAI turns market noise into transparent, actionable investment logic. Go check your favorite stock for an instant deep-dive and see what the AI reveals. Feedback welcome!
 -
 Thanks for your feedback! We are also shipping some exciting new features this month!
 -
-

-
 I really gotta let my heart out, got so many great reviews from my peers. It has helped me make my school work so much easier. I work with little children so when i make it cartoonish it's giving me the best one's yet.
 -
-
-
 Open
Open
-
 Open
Open


Other tools
-
-
When I want to sign up on the Ideogram website with "Continue with Google" and press it, the sentence "Please choose an option to continue" appears below the banner and no action happens. Anybody can help me?
- Sponsor
 MongoDB - Build AI That Scales🗄️ Database
 -
 Automate data work and reporting with AI Agents. No data|coding skills required.OpenSigned up for a pro account for Google Drive integration. Works great! Saves me a lot of manual excel work.
 -
This one was really nice. In that it could also generate a white paper to go with the diagram
-
I really like DataLine, but I'm kinda biased cause I built it.
-
Poor images. Not even come closer to the ask
- Didn't find the AI you were looking for?
-
-
It works for me, might’ve been a temporary issue. Give it another try!
-
 Open
Open -
 OpenReally great number pattern generator. We have taken your tool and made some advanced changes here - https://texttoolz.com/tools/number-pattern-generator
 -
I felt there is need of more ready made templates. But, it does what it claims. I chose one question suggested by the AI agent, and it created the infographics in few seconds. It's cool. Saving it for future reference.
-
 Open
Open -
Great tool, offers a lot of data story suggestion and detailed charts.
-
1. Real-Time Video Preview & Editing 2. Voice Cloning 3. 3D & Knowledge Metaphor Visual Tools 4. Long Video Support 5. Real-Time Asset Injection 6. export All source files 7. Some optimizations to the accuracy of educational videos 8. Solving the problem of frequently using 3D to convey knowledge 9. BrandKit && Support Gemini3.1
-
 One click, every headline: Real-time global news at your fingertips.Open
 -
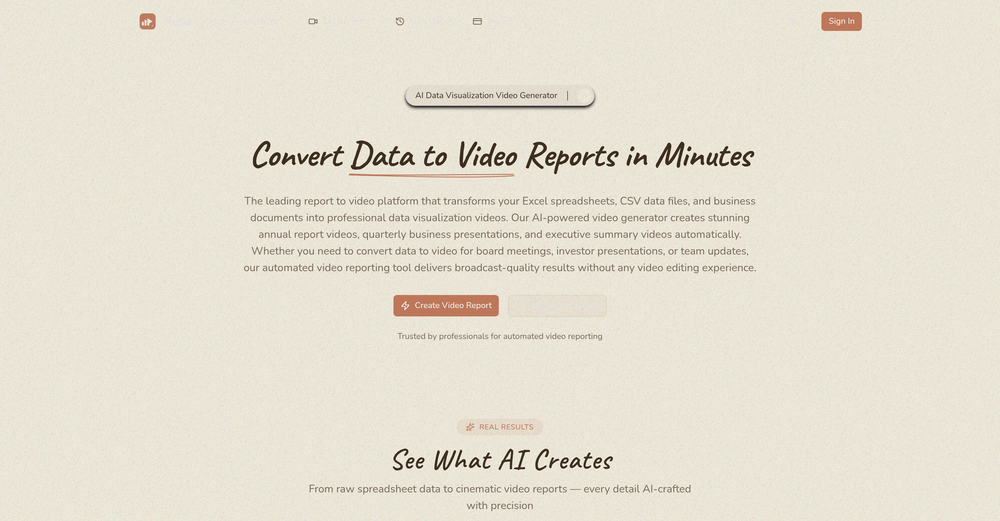
This has got a super-positive future. After creating just one video, I could see that there would be a large use-case for most industries, including mine with Online Marketing. One thing I did notice was that assets that appear on screen often overlap each other. The same was apparent on most of the other videos in their showcase. Once they get over this hurdle, it'll be worth paying for, for sure.
-
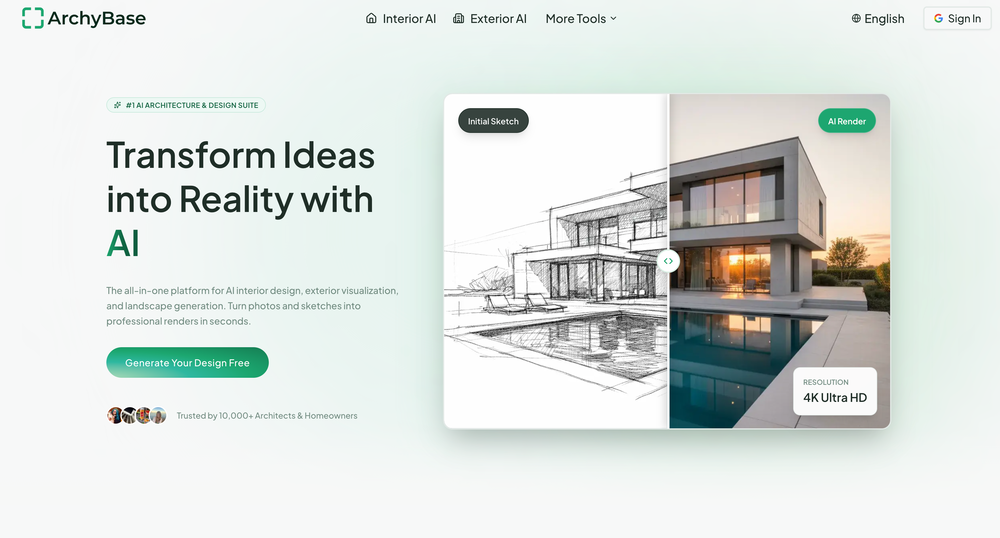
 AI that turns home descriptions into stunning architectural visualizations.Open
 -
very slow , no help and you did not have any feedbck on what happened also It deducts points even without providing any videos or photos.
-
 Visualize scientific concepts with AI-generated imagery.Open
 -
 Transform text into surreal pen-and-pencil sketches with watercolor washes.Openhmmm yeah great, i'm sure i could also recreate these in real life, with pencils
 -
Using it on day-to-day basis to create presentations for my real estate clients. It's good.
-
 AI-powered Excel analysis and visualization in natural languageOpenTired of wrestling with complex formulas, spending hours cleaning data, and struggling to create the right charts? Excelmatic is a powerful web-based AI agent designed to revolutionize your relationship with spreadsheets.
 -
 OpenHi! I'm the founder of LyricEdits. After 20 years as a bass player and 20 years in software engineering, I finally combined both passions into one. I'd love to hear your comments and suggestions!
 -
 Bring history to life with AI-generated visualizations.Open
 -
-
👋 Hey, I'm the founder of Flowova! We built this because we were tired of spending hours dragging boxes in traditional flowchart tools. A few things you might not know: - Works with anything — text, images, PDFs, Word, PPT, Excel, even photos of whiteboard sketches - 40+ themes designed for presentations - Full Mermaid code support for developers Happy to answer any questions! 🚀
-
I was just trying to get a quick graph showing population evolution over the last 30 years, didn’t have the dataset ready, so I was hoping the tool could auto-fill something reasonable. But it literally gave me three values. Three?? For 30 years?? What kind of trend can I possibly see with that? If the tool offers to research the data, it should at least offer a full timeline. And when I pasted the data I found, it created a literally bar chart???
-
Didn't really do the graphs that i thought it would do. Good for simple graphs, like for a presentation
-
If you don't offer any free trial credits or at least show videos without a watermark, no one will feel confident enough to purchase credits without testing it first. People need to verify the quality before committing to a purchase.
-
Scrollsequence is a game-changer for interactive storytelling! Smooth animations, intuitive setup, and impressive control over scrolling sequences make it perfect for engaging web experiences. Highly recommend for designers and developers looking to elevate their sites. 🙌
-
 AI-generated Indian deity avatars blending tradition with modernity.Open
 -
Feels illegal to be this early, quick run with Grok Imagine: great for teaser bits. The image-to-video pass holds up for shorts ~6s loops with decent motion and sound sync. Style range is solid. Access sits behind the Grok sub on mobile, so not fully free and I’d love longer clips!
-
1.🚀 Upgrade to Nano Banana2: Unleash the power of our newest, most advanced AI model. 2.🎨 Free & Unlimited: Say goodbye to credit limits! Generate as many images as you want for free. 3.🖌️ Design Your Way: Master your composition with the intuitive Canvas Composer for custom layouts. 4.🔥 Flash Sale: Get 50% OFF for a limited time only! Don't miss out.
-
 AI-powered analytics that unlock smarter business insights.OpenI used Analytify and found it incredibly easy to set up and integrate with Google Analytics, giving me real-time stats and page-level insights without needing any coding knowledge.
 -
-
 AI-powered microscope for ultra-realistic nano-visuals.Open
 -
 Transform molecular visualization requests into precise PyMOL commands.Open
 -
 Blazingly fast multi-view consistent rendering of 3D models with SketchUp supportOpen
 -
 Transform dream home ideas into stunning architectural visualizations.Open
 -
handy for quick quote cards. text to image is fast, presets and fonts are decent, exports look clean. free tier’s tight and some templates feel samey, but it does the job, so it's aight xD
-
 Transform your D&D adventures with AI-generated character portraits.Open
 -
 Generate professional cookbook-quality food photography prompts instantly.Open
 -
Dumber than a box of hair. Asked for a break even analysis chart. Fed it clear fixed costs, variable costs, net operating income AND ROI percentages. Even hinted that the break even point was between years six and seven. Dude took five minutes to draw a line across the "0" plane labeled "costs" and a revenue line crossing through where I suggested the break even point is. The scale was between 0.2-1.6 USD. No, I am not running a business for ants.
-
 Your guide to creating dynamic music visualizers!Open
 -
 Converting Python code into illustrative diagrams.OpenI like how it gives both PlantUML and Mermaid code, as I found that the Mermaid graph TD code would sometimes not work in the Mermaid Live Editor.
 -
 Expert in construction management, data analysis, and visualization.Open
 -
 Innovative visual creator with interactive idea selection.Open
 -
 Expert in explaining data visuals for academic publishing.Open
 -
 Offering practical advice and visualizations for life enhancement.Open
 -
 Creative assistant for storyboard visualization from video briefs.Open
 -
 A software architect for C4 Model generation.Open
 -
 Get a scatter plot of keyword rankings before and after updates.Open
 -
 Technical expert on Data Visualization and database integrationOpen
 -
 Open
Open -
 Open
Open -
 Advanced data analysis and visualization.Open
 -
 Nigerian fashion advisor with event scenario visualizations.Open
 -
 Generates detailed prompts from images for artistic visualization.Open
 -
 Create your family constellation with DALL-E.Open
 -
 Open
Open -
 Transforming ideas into clear flowcharts with tech stack recommendations.Open
 -
 Creating visually compelling images of the future.Open
 -
-
 Open
Open -
 Practice your visualization and manifestation with this spiritual friend.Open
 -
 Guides in choosing the right business data visualizations.Open
 -
 Create 'Fool Around/Find Out' line charts for your plans.Open
 -
 Playfully creates realistic Lego Box Set images using DALL-E.Open
 -
 Open
Open -
Expert in logic flow visualization and SaaS database structuring.Open
-
 Advanced epidemiology expert with AI-driven data integration and dynamic visualization tools.Open
 -
 Creating detailed, magnified images with educational insights.Open
 -
 Open
Open -
 Automatically tile all professionals and equipment.Open
 -
 See products in a visual transition from intact to exploded views.OpenCan somebody try this tool and post a video and show how it works?
 -
 Generating design images for your exhibition concepts.Open
 -
 Visualize items for characters with photo-realistic images.Open
 -
 Visualizing and safeguarding your year's progress.Open


Post


