

▼ Latest
Visual ideation
Free mode
100% free
Freemium
Free Trial
Featured matches
-
 Poojitha Bandaru🙏 8 karmaDec 26, 2025@ColumnsUI Experience is fast & good with free account limited data (100 csv records) but no 3rd party integrations and limited data connection and no 3D /funnel many more chart visualizations are missing.
 -
 I really gotta let my heart out, got so many great reviews from my peers. It has helped me make my school work so much easier. I work with little children so when i make it cartoonish it's giving me the best one's yet.
 -
-

-
-
Waitlist
 Open
Open


Verified tools
-
-
I felt there is need of more ready made templates. But, it does what it claims. I chose one question suggested by the AI agent, and it created the infographics in few seconds. It's cool. Saving it for future reference.
-
Hi Taaft community! I’m the creator of ConceptViz. We built this tool specifically for educators and researchers who deal with complex information daily. ConceptViz uses AI to instantly transform dense lesson plans, curriculum notes, or research frameworks into clear, structured diagrams. Our goal is to help K12 teachers make abstract concepts tangible for students and to help researchers map out logical workflows without the manual drudgery of drawing. I’d love to hear how this fits into your academic or classroom workflow—your feedback will help us build a better tool for the education community! 🚀
- Sponsor
 Wispr Flow-Now on Android!🎤 Dictation
 -
Looks promising but found it very slow to load and create templates and previews
-


Other tools
-
I was just trying to get a quick graph showing population evolution over the last 30 years, didn’t have the dataset ready, so I was hoping the tool could auto-fill something reasonable. But it literally gave me three values. Three?? For 30 years?? What kind of trend can I possibly see with that? If the tool offers to research the data, it should at least offer a full timeline. And when I pasted the data I found, it created a literally bar chart???
-
handy for quick quote cards. text to image is fast, presets and fonts are decent, exports look clean. free tier’s tight and some templates feel samey, but it does the job, so it's aight xD
-
- Didn't find the AI you were looking for?
-
I think Hatch is the perfect blend of LLMs and creativity. Even though presentations might not be its main focus, it does an outstanding job with them
-
-
I am able to summarize a complex paper into a one-pager visual. Before this tool: hours of reading and summarizing. After this tool: I grasp something complex in seconds. Thank you!!!
-
 Open
Open -
Was very useful for my class assignment. Very easy to edit on and the AI converts sketches into great wireframes.
-
Wow! A really good example of ease and usefulness!
-
When I want to sign up on the Ideogram website with "Continue with Google" and press it, the sentence "Please choose an option to continue" appears below the banner and no action happens. Anybody can help me?
-
Very helpful tool in my design process and coming up with new features!
-
Super artificial intelligence with various features
-
 Transform dream home ideas into stunning architectural visualizations.Open
 -
 Transform molecular visualization requests into precise PyMOL commands.Open
 -
 Transform text into surreal pen-and-pencil sketches with watercolor washes.Openhmmm yeah great, i'm sure i could also recreate these in real life, with pencils
 -
 AI-powered microscope for ultra-realistic nano-visuals.Open
 -
Poor images. Not even come closer to the ask
-
 Visualize scientific concepts with AI-generated imagery.Open
 -
 Open
Open -
 AI-generated Indian deity avatars blending tradition with modernity.Open
 -
 OpenReally great number pattern generator. We have taken your tool and made some advanced changes here - https://texttoolz.com/tools/number-pattern-generator
 -
-
 Transform ideas into cinematic prompts for video production.Open
 -
 Open
Open -
 Technical expert on Data Visualization and database integrationOpen
 -
 Guides in choosing the right business data visualizations.Open
 -
 Crafting SEO-optimized NLP articles with dynamic visuals.Open
 -
 Open
Open -
 Create 'Fool Around/Find Out' line charts for your plans.Open
 -
 Creating detailed, magnified images with educational insights.Open
 -
 Create your family constellation with DALL-E.Open
 -
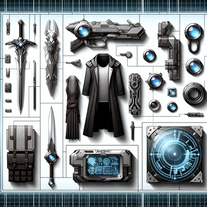 Visualize items for characters with photo-realistic images.Open
 -
 Open
Open -
 Transforming ideas into clear flowcharts with tech stack recommendations.Open
 -
 Open
Open -
 Creating visually compelling images of the future.Open
 -
 Open
Open -
 Playfully creates realistic Lego Box Set images using DALL-E.Open
 -
 Friendly assistant for creating Ren'Py visual novels.Open
 -
 Automatically tile all professionals and equipment.Open
 -
Dumber than a box of hair. Asked for a break even analysis chart. Fed it clear fixed costs, variable costs, net operating income AND ROI percentages. Even hinted that the break even point was between years six and seven. Dude took five minutes to draw a line across the "0" plane labeled "costs" and a revenue line crossing through where I suggested the break even point is. The scale was between 0.2-1.6 USD. No, I am not running a business for ants.
-
 Your guide to creating dynamic music visualizers!Open
 -
 See products in a visual transition from intact to exploded views.OpenCan somebody try this tool and post a video and show how it works?
 -
 Expert in explaining data visuals for academic publishing.Open
 -
 Creative assistant for storyboard visualization from video briefs.Open
 -
 Converting Python code into illustrative diagrams.OpenI like how it gives both PlantUML and Mermaid code, as I found that the Mermaid graph TD code would sometimes not work in the Mermaid Live Editor.
 -
-
 Visualizing and safeguarding your year's progress.Open
 -
 Innovative visual creator with interactive idea selection.Open
 -
 Get a scatter plot of keyword rankings before and after updates.Open
 -
 A software architect for C4 Model generation.Open
 -
 Open
Open -
 Create images making adjectivised nouns progressively more adjective!Open
 -
 Professional curation for diverse podcast topics and visuals.Open
 -
 Generate detailed cinematic visuals with varied effects.Open
 -
 Open
Open


Post


