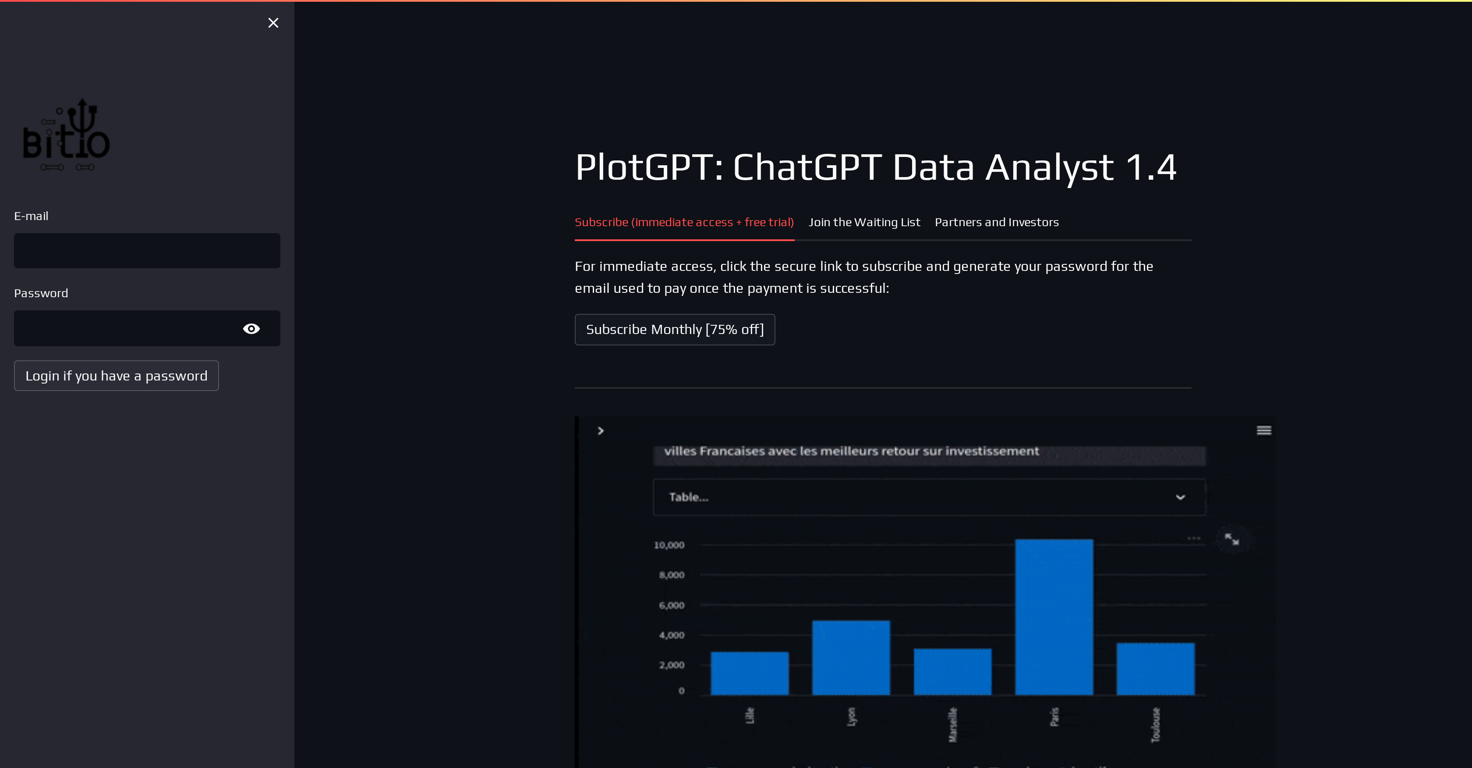
What is PlotGPT?
PlotGPT is an AI-based tool that specializes in data analysis and data visualization. By translating queries into informative visuals such as tables, graphs, and infographs, it allows users to comprehend and interpret data effectively.
How does PlotGPT turn questions into informative plots?
PlotGPT transforms questions into informative plots by using advanced language understanding and data interpretation capabilities. These capabilities enable it to translate queries into visual data formats that are easy to comprehend and interpret.
What is the main function of PlotGPT?
The main function of PlotGPT is to translate any form of question into informative and understandable data visualizations. Bridging the gap between raw information and actionable insights, it transforms complex data into comprehensible formats such as graphs, tables, and infographs.
How does PlotGPT work with ChatGPT?
PlotGPT works with ChatGPT by building upon its capabilities. It uses the advanced language understanding provided by ChatGPT to translate user queries into visual data presentations.
Why should I consider using PlotGPT for data analysis?
You should consider using PlotGPT for data analysis because it presents data in a visually appealing and digestible format, making it easier to understand trends, patterns, and anomalies that can be complex in raw data. Besides, it's available 24/7, making it a reliable tool for continuous data interpretation.
Is PlotGPT user-friendly?
Yes, PlotGPT is user-friendly. It has a simple interface that ensures ease-of-use, potentially broadening the accessibility of data analytics to a larger audience.
What sorts of data presentations can PlotGPT generate?
PlotGPT can generate a wide range of data presentations, such as graphs, tables, and infographs. It's designed to address various queries and transform them into different forms of data visuals.
How does PlotGPT help in recognizing trends from raw data?
PlotGPT aids in recognizing trends from raw data by visualizing it in an easily understandable format. Through data interpretation and pattern recognition, it allows users to quickly identify and comprehend underlying trends in the data.
Can PlotGPT help create infographics?
Yes, PlotGPT can help create infographics. It has the ability to translate questions and raw data into highly informative infographics, facilitating better data comprehension.
Is PlotGPT accessible around the clock?
Yes, PlotGPT is accessible around the clock. It offers 24/7 data analysis service, enabling constant availability for data interpretation and visualization.
How does the query translation feature in PlotGPT work?
The query translation feature in PlotGPT works by utilizing advanced language understanding capabilities from ChatGPT. By understanding the user queries, it translates them into visual data formats, effectively turning questions into informative visuals.
Who can benefit most from using PlotGPT?
Individuals and organizations that regularly deal with data can benefit the most from using PlotGPT. This includes data analysts, researchers, marketers, and anyone who needs to understand patterns, trends, and anomalies in data.
Is PlotGPT beneficial for people without a background in data analytics?
Yes, PlotGPT is beneficial for people without a background in data analytics. Its simple, user-friendly interface makes data analytics more accessible, allowing those with no prior experience to effectively understand and interpret data.
What makes PlotGPT stand out from other data visualization tools?
What sets PlotGPT apart from other data visualization tools is its focus on adaptability and accessibility. It is capable of addressing a wide array of queries, converting them into diverse forms of data presentations. Plus, its simple interface ensures ease-of-use, expanding data analytics accessibility to a larger audience.
Does PlotGPT help understand patterns in complex data?
Yes, PlotGPT does assist in understanding patterns in complex data. By visualizing data in an easy-to-comprehend format, it helps users identify patterns and trends, thereby facilitating better interpretation of complex datasets.
How user-friendly is the interface of PlotGPT?
The interface of PlotGPT is extremely user-friendly. It has been designed for ease-of-use, ensuring that even those without a background in data analytics can navigate through it and effectively interpret data.
What is the ChatGPT App of the year award that PlotGPT won?
The ChatGPT App of the year award that PlotGPT won is an accolade that recognizes its effectiveness in data analysis and visualization. It underlines the innovative use of AI in transforming user queries into easy-to-understand visuals, contributing to better data analytics.
Does PlotGPT offer anomaly detection in data?
While it's not expressly stated, it can be inferred that PlotGPT does offer anomaly detection in data. By visualizing and interpreting data, it can help users identify and understand anomalies that might be hidden in raw data.
Can PlotGPT convert all type of queries into different data presentations?
Yes, PlotGPT can convert all types of queries into different data presentations. Capitalizing on versatility, it is designed to address a diverse range of queries and transform them into informative and understandable visual data formats.
Where can I access PlotGPT?
You can access PlotGPT on its website, which is https://plotgpt.fr

 8545
8545 6621
6621 2491
2491 2035
2035 1803
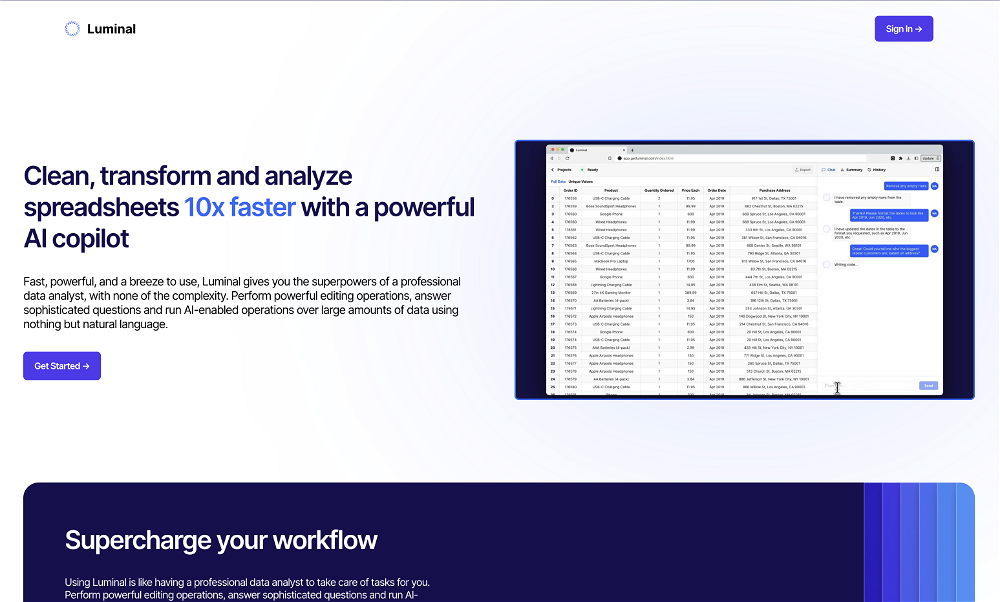
1803 Clean, transform and analyze spreadsheets 10x faster with a powerful AI copilot1292
 104
104 1021
1021 85
85 73
73 72
72 71
71 686
686 67
67 664
664 66
66 621
621 602
602 561
561 53
53 53
53 53
53 53
53 48
48 40
40 35
35 35
35 33
33 311
311 28
28 281
281 28
28 28
28 28
28 Conversational AI Data Analyst: Simplifying Reporting, Amplifying Insights281
 282
282 27
27 27
27 27
27 261
261 26
26 24
24 23
23 22
22 221
221 21
21 Turns a Datasette instance into a ChatGPT plugin to interrogate your data.21
 21
21 20
20 18
18 18
18 18
18 17
17 17
17 17
17 17
17 16
16 16
16 16
16 16
16 16
16 15
15 15
15 15
15 15
15 14
14 14
14 14
14 14
14 13
13 13
13 13
13 13
13 13
13 13
13 13
13 13
13 12
12 12
12 121
121 12
12 Unlock the potential of your data with Dxyfer's AI-based augmented intelligence tools.12
 11
11 11
11 11
11 11
11 111
111 10
10 10
10 10
10 10
10 10
10 10
10 10
10 9
9 91
91 9
9 9
9 9
9 9
9